We have archived this page on the web
The information on this page is for reference only. It was accurate at the time of publishing but may no longer reflect the current state at the Canada Border Services Agency. It is not subject to the Government of Canada web standards.
Canada Border Services Agency Quarterly Financial Report
For the quarter ended
Table of contents
- 1. Introduction
- 2. Highlights of fiscal quarter and fiscal year-to-date (YTD) results
- 3. Risks and uncertainties
- 4. Significant changes in relation to operations, personnel and programs
- 5. Approval by senior officials
- 6. Table 1: Statement of authorities (unaudited)
- 7. Table 2: Departmental budgetary expenditures by standard object (unaudited)
1. Introduction
This Quarterly Financial Report (QFR) has been prepared as required by section 65.1 of the Financial Administration Act and in the form and manner prescribed by the Treasury Board. This quarterly report should be read in conjunction with the Main Estimates, Canada’s Economic Action Plan 2018 (Budget 2018) and Canada’s Economic Action Plan 2019 (Budget 2019).
Information on the ‘raison d’être’, mandate, role and core responsibilities of the Canada Border Services Agency (CBSA) can be found in Part III Departmental Plan and Part II of the Main Estimates.
The QFR has not been subjected to an external audit or review.
1.1 Basis of presentation
This quarterly report has been prepared by management using an expenditure basis of accounting. The accompanying statement of authorities (Table 1) includes the department's spending authorities granted by Parliament, and those used by the department consistent with the Main Estimates (as applicable) for the 2018 to 2019 and 2019 to 2020 fiscal years. This quarterly report has been prepared using a special purpose financial reporting framework designed to meet financial information needs with respect to the use of spending authorities.
The authority of Parliament is required before money can be spent by the Government. Approvals are given in the form of annually approved limits through appropriation acts, or through legislation in the form of statutory spending authority for specific purposes.
When Parliament is dissolved for the purposes of a general election, section 30 of the Financial Administration Act authorizes the Governor General, under certain conditions, to issue a special warrant authorizing the Government to withdraw funds from the consolidated revenue fund. A special warrant is deemed to be an appropriation for the fiscal year in which it is issued.
The department uses the full accrual method of accounting to prepare and present its annual departmental financial statements that are part of the departmental results reporting process. However, the spending authorities voted by Parliament remain on an expenditure basis.
2. Highlights of fiscal quarter and fiscal year-to-date (YTD) results
This section highlights the significant items that contributed to the net increase or decrease in resources available for the year and actual expenditures as of the quarter ended .
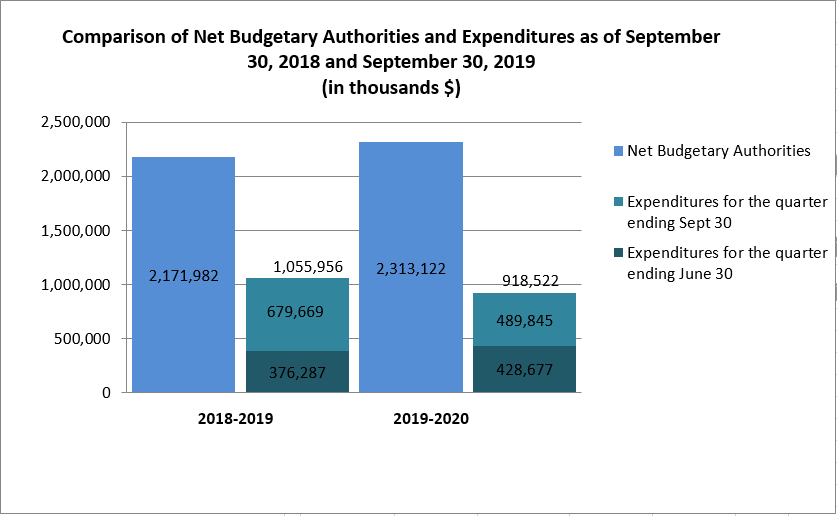
Graph 1: Comparison of net budgetary authorities and expenditures as of and (in thousands $)
2.1 Significant changes to authorities
For the period ending , the authorities provided to the CBSA comprise of the main estimates, Treasury Board (TB) approved budget 2019 measures and any unused spending authorities carried forward from the previous fiscal year. For the period ending , the authorities provided to the CBSA comprise of the Main Estimates, Treasury Board (TB) approved Budget 2018 measures and any unused spending authorities carried forward from the previous fiscal year.
The statement of authorities (Table 1) presents a net increase of $141.1 million or 6.5% in the Agency’s total authorities of $2,313.1 million at compared to $2,172.0 million total authorities at the same quarter last year.
This net increase in the authorities available for use is the result of an increase in vote 1 operating expenditures of $165.4 million, a decrease in vote 5 capital of $59.3 million and an increase in budgetary statutory authorities of $35.0 million, as detailed below
Vote 1: Operating
The agency’s vote 1 operating increased by $165.4 million or 9.6%, which is attributed to the net effect of the following significant items (excluding the statutory authorities):
Increases are mainly attributed to:
- $245.2 million in increases as described in the CBSA Quarterly Financial Report for the quarter ended
- $0.5 million increase for Government-wide initiatives and workload migration
Decreases are mainly attributed to:
- $59.0 million in decreases as described in the CBSA Quarterly Financial Report for the quarter ended
- $21.3 million decreases due to a smaller carry forward of unused spending authorities
Vote 5: Capital
The agency’s vote 5 capital decreased by $59.3 million or 22.9%, which is attributed to the net effect of the following significant items:
Increases are mainly attributed to:
- $23.4 million in increases as described in the CBSA Quarterly Financial Report for the quarter ended
- $13.0 million in increases due to a larger carry forward of unused spending authorities
Decreases are mainly attributed to:
- $95.7 million in decreases as described in the CBSA Quarterly Financial Report for the quarter ended .
Budgetary statutory authorities
The agency’s statutory authority related to the employee benefit plan (EBP) increased by $35.0 million, or 18.8% from the previous year, which is attributed to: $20.1 million for new funding received in the 2019 to 2020 Main Estimates and $14.9 million net increase resulting from the EBP rate changing from 20% to 27% in fiscal year 2019 to 2020.
2.2 Explanations of significant variances in expenditures from previous year
As indicated in the statement of authorities (Table 1), the agency’s expenditures for year-to-date, at quarter end were $918.5 million, as compared to $1,056.0 million for year-to-date, quarter ending . The net decrease of $137.4 millionFootnote 1 or 13.0% in expenditures is mainly due to the following items:
- Decrease of $148.9 million or 15.8% in vote 1 operating expenditures year-to-date used at quarter end ($790.8 million versus $939.7 million same time last year) The bulk of the difference in spending is attributed to an decrease in personnel expenditures due to the ratification of the collective agreement for the Border Service Group (FB) and associated back pay which occurred in the second quarter of fiscal year 2018 to 2019
- Increase of $1.3 million or 4.0% in vote 5 capital expenditures year-to-date used at quarter end ($32.3 million versus $31.1 million same time last year) The increase in expenditures is mainly related to the use of IT consultants to advance the CBSA Assessment and Revenue Management (CARM) project
- Increase of $10.2 million in statutory expenditures
As indicated in the departmental budgetary expenditures by standard object (table 2), the increases by standard object are mainly attributed to:
- Decrease of $159.5 million in personnel costs as a result of the ratification of the collective agreement for the Border Services Group (FB) and associated back pay which occurred in the second quarter of fiscal year 2018 to 2019
- Increase of $14.3 million in professional and special services as a result of information management consultants and property management fees
The planned revenue from the sales of services reflects the agency's revenue respending authority. The year-to-date revenue from the charge for services has increased by $2.1 million or 22.0% mainly due to increased demand for the NEXUS program.
Comparison of vote netted revenue and revenue collected as of and (in thousands $)
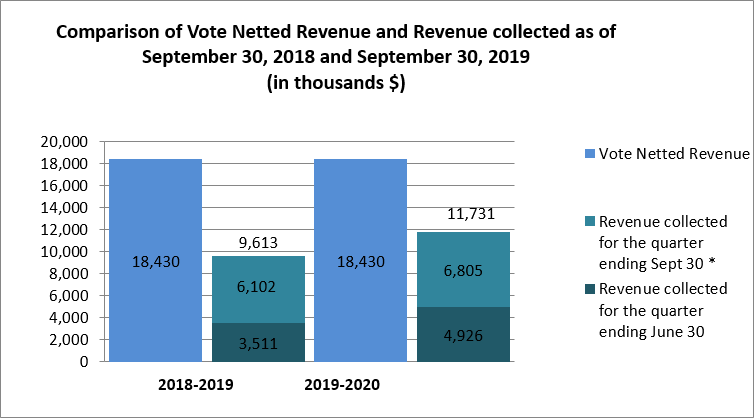
* Revenue collected for the quarter ending September 2018 is restated to include other revenue.
3. Risks and uncertainties
The CBSA’s changing operating environment makes the agency particularly susceptible to external drivers that are largely beyond its control. Together, these drivers have the potential to affect the organization’s ability to adhere to its annual financial plan.
Increased volumes of immigration processing, including increases in asylum claims and related enforcement activities, coupled with increased volumes resulting from eCommerce, have placed additional demands on resources. Budget 2019 provided some new funding to help the agency modernize its programs, services, and infrastructure to meet the demands of rising volumes of trade and travel.
The agency is in the process of nationalizing its internal services functions. The transition is occurring in two waves. The first wave occurred on , when the Communications, Real Property, Security and Human Resources communities began reporting nationally. Wave 2, which will see the nationalization of Procurement, Information Management, Information Technology and Materiel Management, as well as elements of finance, is scheduled to occur on .
The agency is pursuing several large information technology (IT) and physical infrastructure projects. Most are multi-year in nature and represent substantial investments. Specific to information technology, the agency continues to support services it is expecting to phase out while waiting for the delivery of government-wide corporate solutions which include secure cloud computing and data storage.
Delays can add additional challenges as project costing does not always allow for fluctuating costs for materials commodities and other market rate price changes. Inflation also drives up costs on deferred or delayed projects.
The agency strives to mitigate financial risks by risk-rating its projects, conducting periodic project reviews, and by holding regular budget discussions. Such activities are informed and supported by agency quarterly integrated project reporting processes.
4. Significant changes in relation to operations, personnel and programs
4.1 Key senior personnel
Effective August 6th, Paul MacKinnon became the new Executive Vice-President.
4.2 Operations
Effective , the Canada Border Services Agency officially launched its enhanced functional management model. Under this new model, Vice-Presidents of the three business line branches (Travellers, Commercial and Trade and Intelligence and Enforcement) are accountable for program transformation, development, design and delivery, from coast-to-coast and end-to-end with the direct support of all regions. They are the business owners and are accountable for driving major information technology projects within their functional areas, which is an industry best practice and in line with other government departments. The Information, Science and Technology Branch (ISTB) will continue to oversee the technical aspects of these projects. Regional Directors General (RDGs) are now directly accountable to the three Vice-Presidents.
The National Real Property and Accommodations Directorate (NRPAD) completed its national realignment of resources on March 31st 2019. The resulting impact will enable the organization to more effectively and efficiently operationalize key priorities and enhance our capacity to manage the Agency’s custodial, leasehold and legislated portfolios thereby expanding the Directorates ability to support the CBSA renewal initiative. The nationalized model is designed to support a nationally consistent and innovative approach to modernizing the agency’s border infrastructure by leveraging regional and national project management expertise through integrated investment planning and data-driven reporting strategies. To ensure that the organization is properly positioned to respond to and support the evolving dynamic real property demands of the CBSA, NRPAD is developing a Professional Development Plan (PDP) that will clearly identify the required core competencies and skill sets, strengthen succession planning, generate knowledge transfer and retention, and promote the CBSA as an employer of choice.
Additionally, following the Budget 2019 funding decision, the agency has established the organizational framework required to deliver the Port of Entry replacement projects identified in the Land Border Crossing Project.
The agency continues to make progress on the re-alignment of its material management portfolio with an expected completion date of spring 2020.
4.3 New programs
Looking forward, the agency is committed to the vision of CBSA Renewal, which is designed to maximize the potential that technology brings and further implement innovation to enable officers to stand strong and provide effective service amidst rising volumes and ever evolving security threats. In support of CBSA renewal, the agency has also established a dedicated change management office and a culture team within the Chief Transformation Officer Branch to build cultural support for modernized business processes and improve the agency’s ability to implement and adapt to change.
5. Approval by senior officials
Approved by:
John Ossowski
President
Ottawa, Canada
Date: November 29, 2019
Jonathan Moor
Chief Financial Officer
Ottawa, Canada
Date: November 26, 2019
6. Table 1: Statement of authorities (unaudited)
| Total available for use for the year ending * | Used during the quarter ended | Year-to-date used at quarter end | |
|---|---|---|---|
| Vote 1: Operating expenditures | 1,892,776 | 419,984 | 790,763 |
| Vote 5: Capital expenditures | 199,453 | 22,059 | 32,311 |
| Statutory authority: Contributions to employee benefit plans | 220,893 | 47,613 | 95,227 |
| Statutory authority: Refunds of amounts credited to revenues in previous years | 0 | 2 | 3 |
| Statutory authority: Spending of proceeds from the disposal of surplus Crown assets | 0 | 187 | 218 |
| Total budgetary authorities | 2,313,122 | 489,845 | 918,522 |
| Non-budgetary authorities | 0 | 0 | 0 |
| Total authorities | 2,313,122 | 489,845 | 918,522 |
| Note: Numbers may not add due to rounding. * Includes only Authorities available for use and granted by Parliament at quarter end. |
|||
| Total available for use for the year ending * | Used during the quarter ended | Year-to-date used at quarter end | |
|---|---|---|---|
| Vote 1: Operating expenditures | 1,727,323 | 613,553 | 939,699 |
| Vote 5: Capital expenditures | 258,723 | 23,514 | 31,060 |
| Statutory authority: Contributions to employee benefit plans | 185,936 | 42,586 | 85,172 |
| Statutory authority: Refunds of amounts credited to revenues in previous years | 0 | 5 | 5 |
| Statutory authority: Spending of proceeds from the disposal of surplus Crown assets | 0 | 11 | 20 |
| Total budgetary authorities | 2,171,982 | 679,669 | 1,055,956 |
| Non-budgetary authorities | 0 | 0 | 0 |
| Total authorities | 2,171,982 | 679,669 | 1,055,956 |
| Note: Numbers may not add due to rounding. * Includes only Authorities available for use and granted by Parliament at quarter end. |
|||
7. Table 2: departmental budgetary expenditures by standard object (unaudited)
| Planned expenditures for the year ending * | Expended during the quarter ended | Year-to-date used at quarter end | |
|---|---|---|---|
| Expenditures | |||
| Personnel | 1,714,656 | 373,541 | 737,508 |
| Transportation and communications | 44,707 | 11,249 | 22,367 |
| Information | 15,450 | 101 | 937 |
| Professional and special services | 273,719 | 79,393 | 124,725 |
| Rentals | 7,254 | 4,238 | 5,060 |
| Repair and maintenance | 41,782 | 4,432 | 9,514 |
| Utilities, materials and supplies | 13,253 | 3,516 | 5,210 |
| Acquisition of land, buildings and works | 92,758 | 10,310 | 11,660 |
| Acquisition of machinery and equipment | 106,887 | 7,172 | 8,362 |
| Transfer payments | 0 | 0 | 0 |
| Other subsidies and payments | 21,086 | 2,698 | 4,910 |
| Total gross budgetary | 2,331,552 | 496,650 | 930,253 |
| Less revenues netted against expenditures | |||
| Sales of services | 18,430 | 6,807 | 11,734 |
| Other revenue | 0 | (2) | (3) |
| Total revenues netted against expenditures | 18,430 | 6,805 | 11,731 |
| Total net budgetary expenditures | 2,313,122 | 489,845 | 918,522 |
| Note: Numbers may not add due to rounding. * Includes only Authorities available for use and granted by parliament at quarter-end. |
|||
| Planned expenditures for the year ending * | Expended during the quarter ended | Year-to-date used at quarter end | |
| Expenditures | |||
|---|---|---|---|
| Personnel | 1,472,106 | 576,828 | 897,044 |
| Transportation and communications | 52,447 | 11,545 | 20,435 |
| Information | 8,677 | 102 | 283 |
| Professional and special services | 310,146 | 73,063 | 110,454 |
| Rentals | 7,965 | 2,176 | 3,318 |
| Repair and maintenance | 36,572 | 4,196 | 8,033 |
| Utilities, materials and supplies | 23,972 | 3,087 | 4,957 |
| Acquisition of land, buildings and works | 115,990 | 10,475 | 11,782 |
| Acquisition of machinery and equipment | 139,544 | 3,154 | 5,655 |
| Transfer payments | 0 | 0 | 0 |
| Other subsidies and payments | 22,993 | 1,145 | 3,608 |
| Total gross budgetary expenditures | 2,190,412 | 685,771 | 1,065,569 |
| Less revenues netted against expenditures | |||
| Sales of services | 18,430 | 6,107 | 9,618 |
| Other revenue | 0 | (5) | (5) |
| Total revenues netted against expenditures | 18,430 | 6,102 | 9,613 |
| Total net budgetary expenditures | 2,171,982 | 679,669 | 1,055,956 |
| Note: Numbers may not add due to rounding. * Includes only Authorities available for use and granted by Parliament at quarter-end. | |||
- Date modified: