
Canada Border Services Agency: Quarterly financial report for the first quarter of fiscal year 2026 to 2027
On this page
- 1. Introduction
- 2. Highlights of fiscal quarter and fiscal year-to-date (YTD) results
- 3. Risks and uncertainties
- 4. Significant changes in relation to operations, personnel and programs
- 5. Approval by senior officials
- 6. Table 1: Statement of authorities (unaudited)
- 7. Table 2: Departmental budgetary expenditures by standard objects (unaudited)
1. Introduction
The Q1 Quarterly Financial Report (QFR) has been prepared as required by section 65.1 of the Financial Administration Act and in the form and manner prescribed by the Treasury Board. This quarterly report should be read in conjunction with the Main Estimates.
Information on the raison d’être, mandate, role and core responsibilities of the Canada Border Services Agency (CBSA) can be found in Part III Departmental Plan and Part II of the Main Estimates.
The QFR has not been subjected to an external audit or review, but has been reviewed internally by the departmental Audit Committee.
1.1 Basis of presentation
This quarterly report has been prepared by management using an expenditure basis of accounting. The accompanying statement of authorities (Table 1) includes the department's spending authorities granted by Parliament, and those used by the department consistent with the Main Estimates for the to and to fiscal years. This quarterly report has been prepared using a special purpose financial reporting framework designed to meet financial information needs with respect to the use of spending authorities.
The authority of Parliament is required before money can be spent by Government departments. Approvals are given in the form of annually approved limits through appropriation acts, or through legislation in the form of statutory spending authority for specific purposes.
The department uses the full accrual method of accounting to prepare and present its annual departmental financial statements that are part of the departmental results reporting process. However, the spending authorities voted by Parliament remain on an expenditure basis.
2. Highlights of fiscal quarter and fiscal year-to-date (YTD) results
This section highlights the significant items that contributed to the net increase or decrease in resources available for the year and actual expenditures as of the quarter ended .
Graph 1: Comparison of net budgetary authorities and expenditures as of , and (in thousands $)
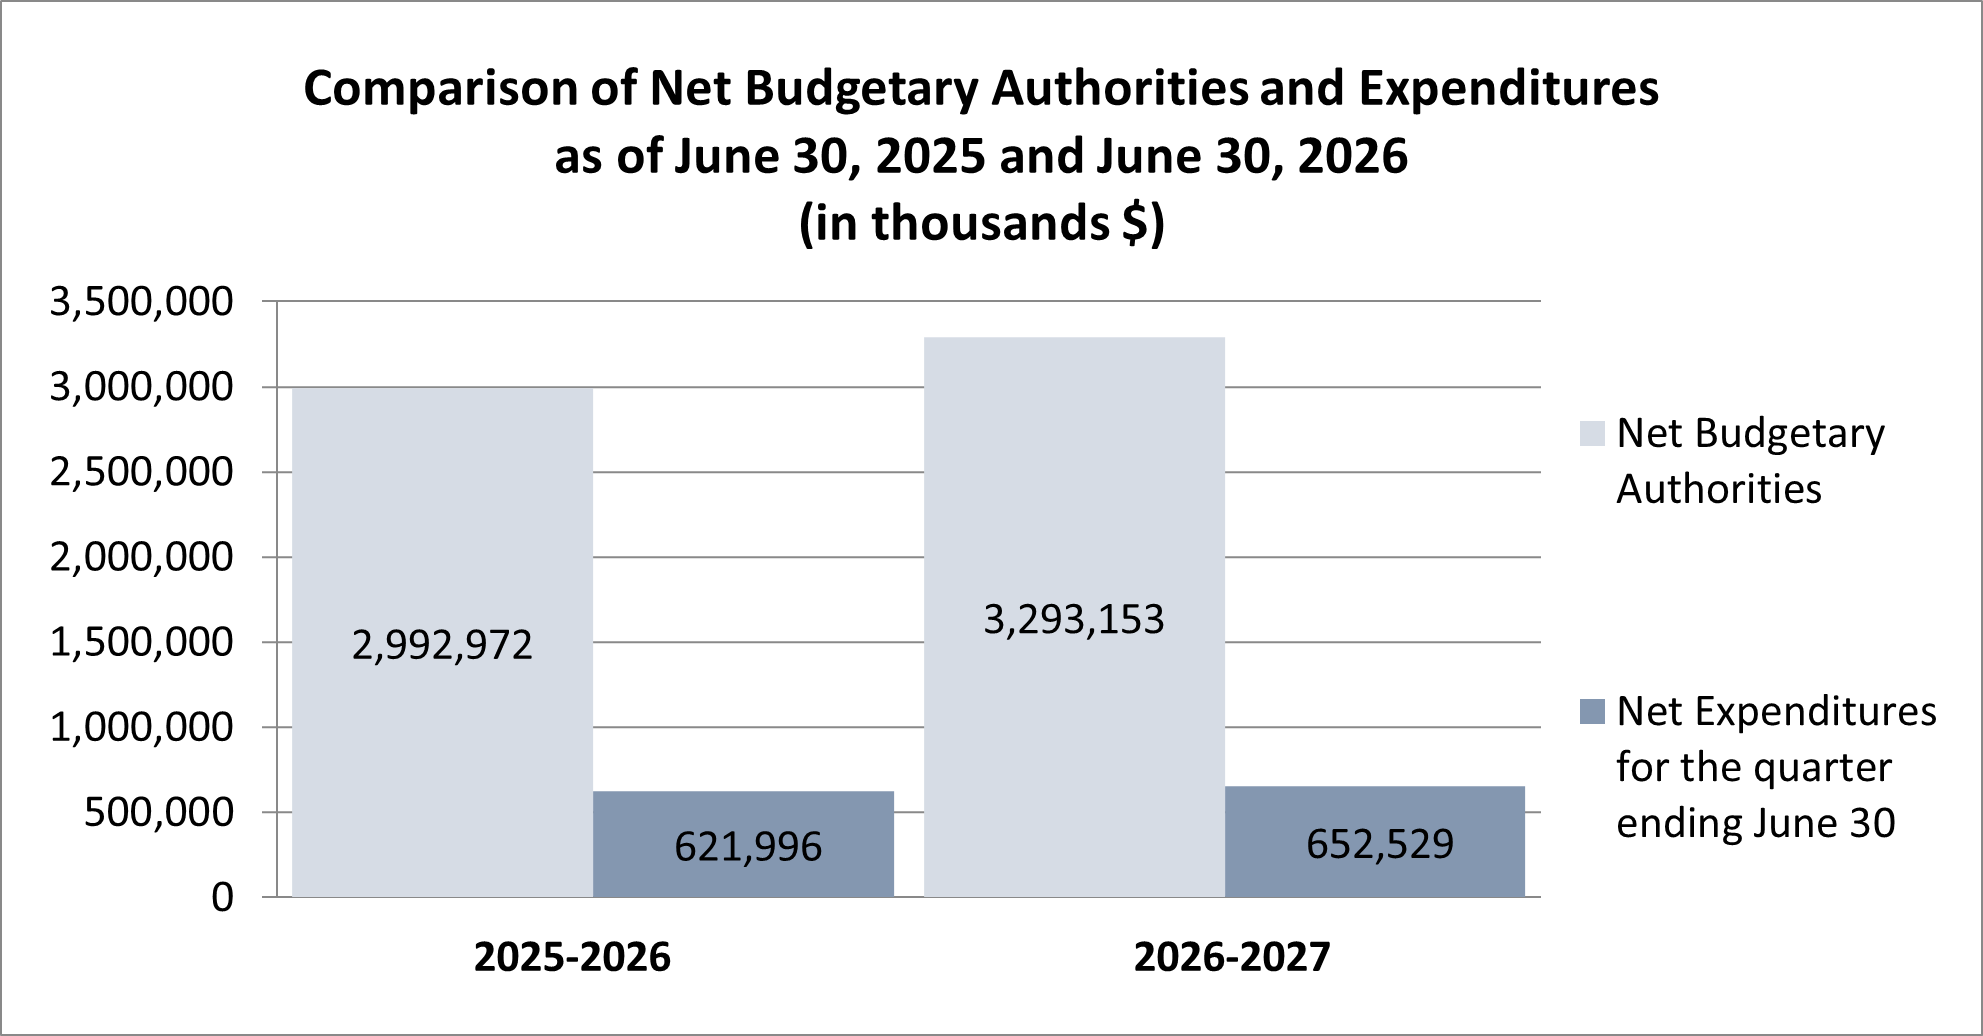
Image description
Comparison of net budgetary authorities and expenditures as of and (in thousands $)
| - | - | |
|---|---|---|
| Net Budgetary Authorities | 2,992,972 | 3,293,153 |
| Net Expenditures for the quarter ending June 30 | 621,996 | 652,529 |
2.1 Significant changes to authorities
For the period ending , the authorities provided to the CBSA are comprised of the Main Estimates and any unused spending authorities carried forward from the previous fiscal year.
The statement of authorities (Table 1) presents a net increase of $300.1 million or 10% of the Agency’s total authorities of $3,293.1 million for fiscal 2026 to 2027, compared to $2,993.0 million total authorities last year for last fiscal year 2025 to 2026.
This net increase in the authorities available for use is the result of an increase in Vote 1 – Operating Expenditures of $78.4 million, an increase in Vote 5 – Capital Expenditures of $164.6 million and an increase in budgetary statutory authorities of $57.1 million, as detailed below.
Vote 1: Operating
The agency’s Vote 1 increased by $78.4 million or 3.1% (excluding the statutory authorities), compared to the same period last fiscal year. The increase is attributed to the net effect of the following significant items:
- $122 million increase due to the timing of receiving the carry forward of unused spending authorities; and
- $43.6 million net decreases in Main Estimates
- The main decreases contributing to the changes in operating funding include:
- $44.1 million reduction under the Comprehensive Expenditures Review
- $31.6 million planned funding profile change for Irregular Migration & Incremental Asylum
- $21.8 million planned funding profile change for Immigration Holding Centre
- $5.7 million planned funding profile change for Traveller Modernization
- $5.2 million planned funding profile change for Gordie Howe International Bridge point of entry (POE)
- These decreases are partially offset by a $71.3 million increase in funding to reinforce Canada’s borders
- The main decreases contributing to the changes in operating funding include:
Vote 5: Capital
The Agency’s Vote 5 increased by $164.6 million or 95% (excluding the statutory authorities), compared to the same period last fiscal year. The increase is attributed to the net effect of the following significant items:
- $101.2 million increase due to the timing of receiving the carry forward of unused spending authorities; and
- $63.4 million net increases in Main Estimates.
- The main increases contributing to the changes in capital funding include:
- $33.5 million to increase enhance border integrity
- $23.9 million planned funding profile change for Marine Container Examination Facility
- $18.9 million to support the Land Border Crossing Project
- These increases are partially offset by a $6.6 million decrease in funding for Gordie Howe International Bridge POE
- The main increases contributing to the changes in capital funding include:
Budgetary statutory authorities
The Agency’s Statutory Authority increased by $57.1 million or 20.3%, compared to the same period last fiscal year. The increase is attributed to the increase of the following items:
- $40 million in respendable revenues as a result of applying the statutory revenue spending authority available to the CBSA as a departmental corporation under subsection 29.1(1) of the Financial Administration Act; and
- $17.1 million increase related to employee benefit plan (EBP) due to an EBP adjustment set by the Treasury Board
2.2 Explanations of significant variances in expenditures from previous year
As indicated in the statement of authorities (Table 1), the Agency’s year-to-date expenditures, at quarter end , were $652.5 million, compared to $622.0 million for year-to-date, quarter ending . Current spending rates are in line with historical expenditure patterns for the same period, indicating no significant variance from expected trends.
Graph 2: Comparison of vote netted revenue budget and revenue collected as of , and (in thousands $)
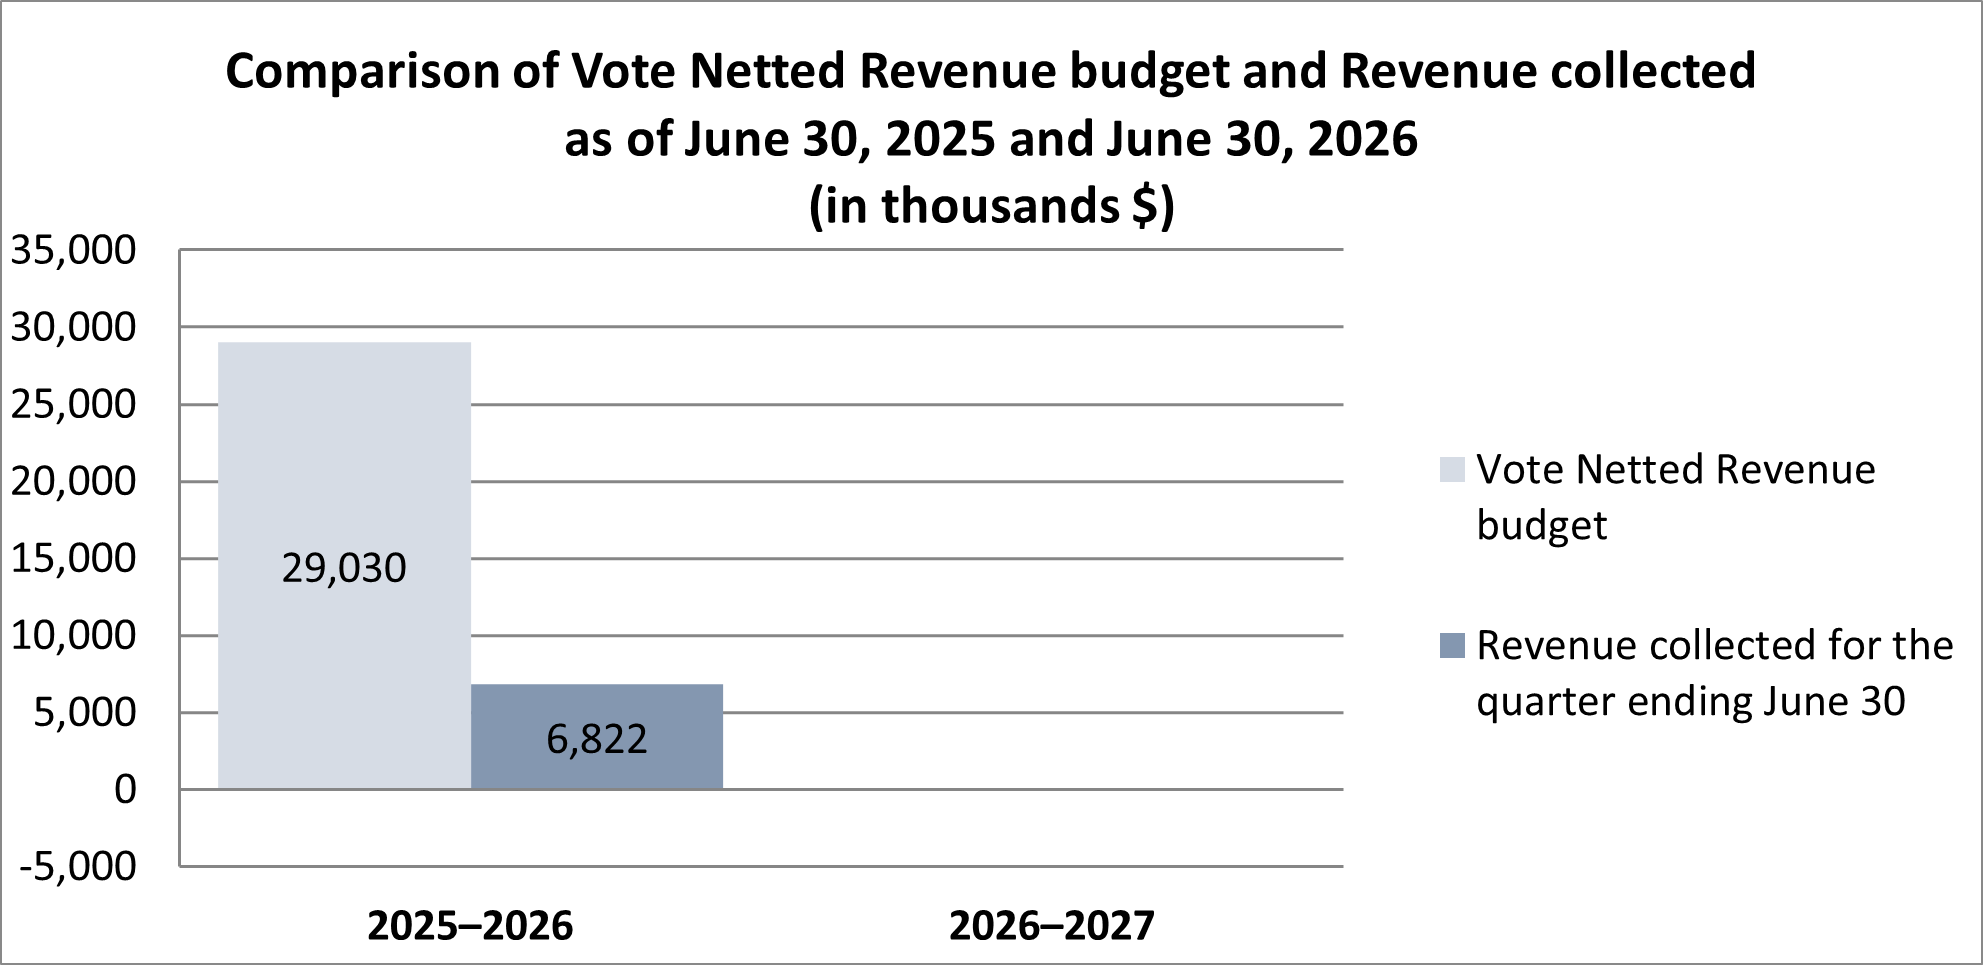
Image description
Comparison of vote netted revenue budget and revenue collected as of and (in thousands $)
| - | - | |
|---|---|---|
| Vote Netted Revenue budget | 29,030 | 0 |
| Revenue collected for the quarter ending June 30 | 6,822 | -3 |
Starting in fiscal year 2026 to 2027, the Agency began applying the statutory revenue spending authority available to it as a departmental corporation under subsection 29.1(1) of the Financial Administration Act.
This approach replaced the previous “vote-netted revenue” authority, and offers improved revenue management flexibility enabling the Agency’s branches and regions to reinvest all service fee proceeds on operations.
3. Risks and uncertainties
The financial and expenditure management risks are reflected in various products which provide the pillars for monitoring and managing the risks in the Agency, specifically the Risk and Compliance Process. Mitigation measures are in place to manage these risks, resulting in a relatively low risk level of medium-low for both.
3.1 Delivery of major projects
Given the large, nationally-distributed nature of the Agency, there is a risk of misalignment of resource allocation at the lowest level, limiting the Agency’s ability to re-allocate to emerging priorities in a timely manner.
Mitigations:
- Standardize the national approach to in-year Financial Situation Reporting and the in-year reallocation process to support emerging pressures and maximize use of funds.
- Continue engagement through regular Agency-wide One|Finance Forum and Agency Planning Network meetings to inform all levels of management of common and current financial priorities and pressures.
- Continuously improve the annual forward planning exercise through three (3)-year Integrated Business Planning, which enables the development of priority-driven, risk-informed plans that are aligned with approved budgets.
- Provide financial management training sessions for all managers, tailored to the needs of the Agency and updated regularly to address emerging issues.
Residual Risk Exposure After mitigations: Low-medium
3.2 Reliance on time-limited funding
There is a risk that the sunsetting of time-limited funding, combined with uncertainty surrounding future renewals, may limit the Agency's capacity to maintain service excellence, and address emerging operational demands. This could result in delays to critical initiatives, increased pressure on existing resources and reduced organizational flexibility in responding to evolving priorities.
Mitigation Measures:
- Forward Planning annual through 3-year Integrated Business Planning, which increases oversight helps to ensure the multi-year affordability of the organization
- In year Financial Situation Reporting and reallocation strategies to support emerging pressures and maximize use of funds
- Staffing controls to limit growth to critical replacements and new funding only
Residual Risk Exposure after mitigation measures: Low-Medium
4. Significant changes in relation to operations, personnel and programs
4.1 Key senior personnel
There were no significant changes in the CBSA’s key senior personnel during the first quarter fiscal year 2026 to 2027, although it should be noted that the Agency welcomed its new Chief Financial Officer, Scott Davis, and new Vice-President of Intelligence and Enforcement Branch, Nicole Giles, at the start of the second quarter of fiscal year 2026 to 2027.5. Approval by senior officials
Approved by:
Erin O'Gorman
President
Ottawa, Canada
Date:
Scott Davis
Chief Financial Officer
Ottawa, Canada
Date:
6. Table 1: Statement of authorities (unaudited)
| (in thousands of dollars) | Total available for use for the year ending Footnote 1 | Used during the quarter ended | Year-to-date used at quarter end |
|---|---|---|---|
| Vote 1: Operating expenditures | 2,616,768 | 558,946 | 558,946 |
| Vote 5: Capital expenditures | 338,019 | 18,991 | 18,991 |
| Statutory authority — Contributions to employee benefit plans | 298,322 | 74,580 | 74,580 |
| Statutory authority — Respendable revenues | 40,043 | 0 | 0 |
| Statutory authority — Refunds of amounts credited to revenues in previous years | 0 | 3 | 3 |
| Statutory authority — Spending of proceeds from the disposal of surplus Crown assets | 0 | 9 | 9 |
| Total budgetary authorities | 3,293,152 | 652,529 | 652,529 |
| Non-budgetary authorities | 0 | 0 | 0 |
| Total authoritiesFootnote 2 | 3,293,152 | 652,529 | 652,529 |
| (in thousands of dollars) | Total available for use for the year ending Footnote 1 | Used during the quarter ended | Year-to-date used at quarter end |
|---|---|---|---|
| Vote 1: Operating expenditures | 2,538,381 | 542,021 | 542,021 |
| Vote 5: Capital expenditures | 173,374 | 9,662 | 9,662 |
| Statutory authority — Contributions to employee benefit plans | 281,217 | 70,304 | 70,304 |
| Statutory authority — Refunds of amounts credited to revenues in previous years | 0 | 0 | 0 |
| Statutory authority — Spending of proceeds from the disposal of surplus Crown assets | 0 | 9 | 9 |
| Total budgetary authorities | 2,992,972 | 621,996 | 621,996 |
| Non-budgetary authorities | 0 | 0 | 0 |
| Total authoritiesFootnote 2 | 2,992,972 | 621,996 | 621,996 |
7. Table 2: Departmental budgetary expenditures by standard objects (unaudited)
| (in thousands of dollars) | Planned expenditures for the year ending Footnote 1 | Expended during the quarter ended | Year-to-date used at quarter end |
|---|---|---|---|
| Expenditures | |||
| Personnel | 2,161,465 | 542,824 | 542,824 |
| Transportation and communications | 87,843 | 12,859 | 12,859 |
| Information | 6,918 | 1,627 | 1,627 |
| Professional and special services | 630,575 | 64,809 | 64,809 |
| Rentals | 14,780 | 1,795 | 1,795 |
| Repair and maintenance | 78,531 | 4,344 | 4,344 |
| Utilities, materials and supplies | 73,956 | 3,716 | 3,716 |
| Acquisition of land, buildings and works | 108,873 | 5,658 | 5,658 |
| Acquisition of machinery and equipment | 98,866 | 11,329 | 11,329 |
| Transfer payments | 0 | 0 | 0 |
| Other subsidies and payments | 31,345 | 3,565 | 3,565 |
| Total gross budgetary expenditures | 3,293,152 | 652,526 | 652,526 |
| Less revenues netted against expenditures | |||
| Sales of services | 0 | 0 | 0 |
| Other revenue | 0 | -3 | -3 |
| Total revenues netted against expenditures | 0 | -3 | -3 |
| Total net budgetary expendituresFootnote 2 | 3,293,152 | 652,529 | 652,529 |
| (in thousands of dollars) | Planned expenditures for the year ending March 31, 2026Footnote 1 | Expended during the quarter ended | Year-to-date used at quarter end |
|---|---|---|---|
| Expenditures | |||
| Personnel | 2,119,237 | 534,222 | 534,222 |
| Transportation and communications | 79,326 | 9,239 | 9,239 |
| Information | 3,107 | 853 | 853 |
| Professional and special services | 485,132 | 61,465 | 61,465 |
| Rentals | 13,496 | 5,601 | 5,601 |
| Repair and maintenance | 58,445 | 2,567 | 2,567 |
| Utilities, materials and supplies | 58,296 | 3,158 | 3,158 |
| Acquisition of land, buildings and works | 89,557 | 2,975 | 2,975 |
| Acquisition of machinery and equipment | 90,925 | 5,590 | 5,590 |
| Transfer payments | 0 | 0 | 0 |
| Other subsidies and payments | 24,481 | 3,148 | 3,148 |
| Total gross budgetary expenditures | 3,022,002 | 628,818 | 628,818 |
| Less revenues netted against expenditures | |||
| Sales of services | 29,030 | 6,822 | 6,822 |
| Other revenue | 0 | 0 | 0 |
| Total revenues netted against expenditures | 29,030 | 6,822 | 6,822 |
| Total net budgetary expendituresFootnote 2 | 2,992,972 | 621,996 | 621,996 |
Page details
- Date modified: