
Reports: Standing Committee on Public Safety and National Security: Canada – U.S. Border Security (December 12, 2024)
Study permit issuance report
December 2 to 8, 2024
- Study Permits Issued by CBSA (December 2 to 8, 2024): 2,930 (70% increase)
- Study Permits Processed by Express Permit Macro (EPM) (December 2 to 8, 2024): 31 (1%)
| Region | This week (Dec 2 to 8, 2024) |
Last week (Nov 25 to Dec 1, 2024) |
Percentage Increase/Decrease |
Past 4 weeks (Nov 11 to Dec 8, 2024) |
2024 total |
|---|---|---|---|---|---|
| Atlantic | 13 | 14 | minus7% | 39 | 1,818 |
| Quebec | 783 | 516 | 52% | 2,120 | 61,298 |
| Northern Ontario | 35 | 27 | 30% | 103 | 2,249 |
| Greater Toronto Area | 1,236 | 649 | 90% | 2,752 | 119,081 |
| Southern Ontario | 41 | 39 | 5% | 177 | 2,789 |
| Prairie | 139 | 62 | 124% | 310 | 11,889 |
| Pacific | 683 | 420 | 63% | 1,816 | 66,850 |
| Total | 2,930 | 1,727 | 70% | 7,317 | 265,974 |
| Source: CBSA DAPRU Weekly International Student Volume Statistics Report | |||||
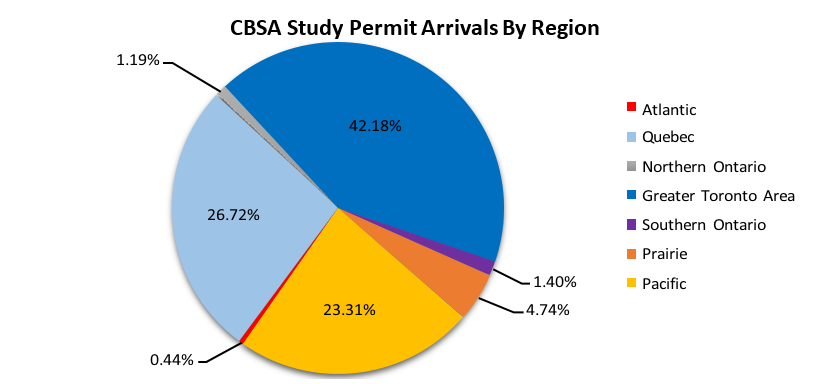
Figure 1 - Text version
| (%) | |
|---|---|
| Atlantic | 0.44 |
| Quebec | 26.72 |
| Northern Ontario | 1.19 |
| Greater Toronto Area | 42.18 |
| Southern Ontario | 1.40 |
| Prairie | 4.74 |
| Pacific | 23.31 |
| Rank | Port of entry | Total |
|---|---|---|
| 1 | Toronto Pearson International Airport | 1,233 |
| 2 | Montreal-Trudeau International Airport | 750 |
| 3 | Vancouver International Airport | 648 |
| 4 | Calgary International Airport | 81 |
| 5 | Edmonton International Airport | 42 |
| 6 | Niagara Falls Rainbow Bridge POE | 32 |
| 7 | Ottawa MacDonald-Cartier International Airport | 21 |
| 8 | Saint-Bernard-De-Lacolle POE | 10 |
| 9 | Boundary Bay POE | 10 |
| 10 | Douglas POE | 9 |
| All Other POEs | 94 | |
| Total | 2,930 | |
| Source: CBSA DAPRU Weekly International Student Volume Statistics Report | ||
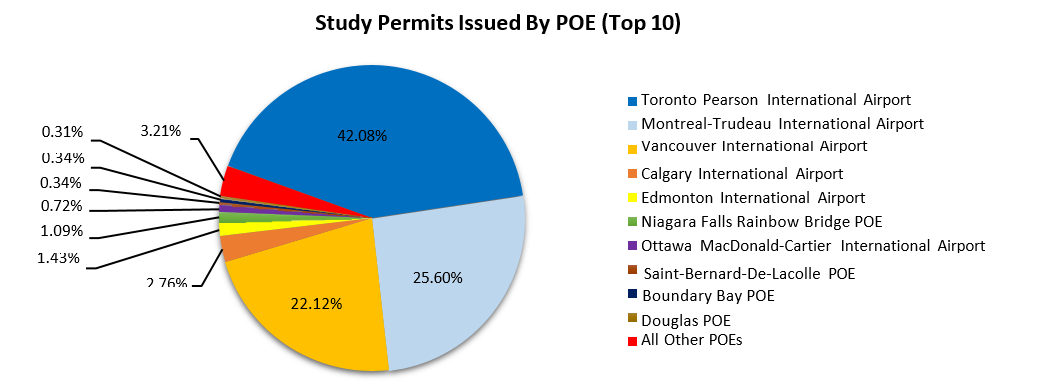
Figure 2 - Text version
| (%) | |
|---|---|
| Toronto Pearson International Airport | 42.08 |
| Montreal-Trudeau International Airport | 25.60 |
| Vancouver International Airport | 22.12 |
| Calgary International Airport | 2.76 |
| Edmonton International Airport | 1.43 |
| Niagara Falls Rainbow Bridge POE | 1.09 |
| Ottawa MacDonald-Cartier International Airport | 0.72 |
| Saint-Bernard-De-Lacolle POE | 0.34 |
| Boundary Bay POE | 0.34 |
| Douglas POE | 0.31 |
| All Other POEs | 3.21 |
| Rank | Country of citizenship | Total |
|---|---|---|
| 1 | India | 773 |
| 2 | Philippines | 267 |
| 3 | Nigeria | 222 |
| 4 | China | 156 |
| 5 | Algeria | 104 |
| 6 | Iran | 93 |
| 7 | Senegal | 89 |
| 8 | Morocco | 78 |
| 9 | Vietnam | 75 |
| 10 | Guinea | 74 |
| All other citizenships | 999 | |
| Total | 2,930 | |
| Source: CBSA DAPRU Weekly International Student Volume Statistics Report | ||
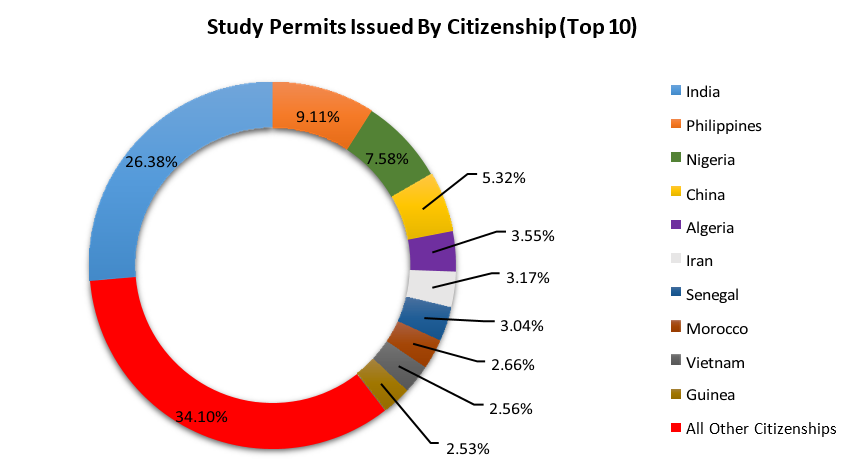
Figure 3 - Text version
| (%) | |
|---|---|
| India | 26.38 |
| Philippines | 9.11 |
| Nigeria | 7.58 |
| China | 5.32 |
| Algeria | 3.55 |
| Iran | 3.17 |
| Senegal | 3.04 |
| Morocco | 2.66 |
| Vietnam | 2.56 |
| Guinea | 2.53 |
| All other citizenships | 34.10 |
| Jan | Feb | Mar | Apr | May | Jun | Jul | Aug | Sep | Oct | Nov | Dec | |
|---|---|---|---|---|---|---|---|---|---|---|---|---|
| 2023 actual | 25,838 | 8,359 | 12,155 | 63,464 | 19,667 | 15,076 | 24,865 | 152,468 | 53,969 | 10,851 | 13,524 | 95,301 |
| 2024 actual | 27,517 | 9,204 | 16,814 | 45,679 | 13,901 | 11,290 | 16,826 | 79,981 | 28,539 | 6,520 | 6,521 | - |
| 2024 IRCC projected | - | - | - | - | - | 10,700 | 16,700 | 112,000 | 57,700 | 12,600 | 13,700 | 69,700 |
| Based on IRCC's Arrival Projections document, historical data and DAPRU volume statistics reports | ||||||||||||
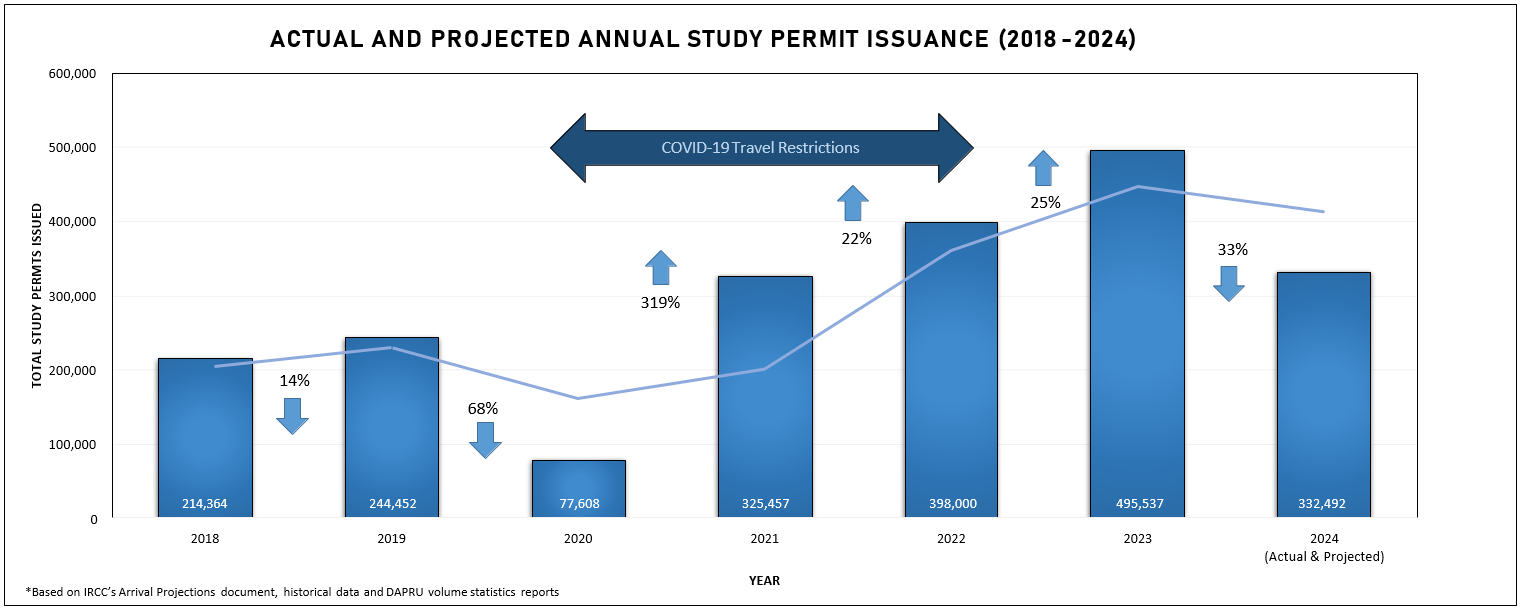
Figure 4 - Text version
| Year | Total | Percentage change (%) |
|---|---|---|
| 2017 to 2018 | 214,364 | 0 |
| 2018 to 2019 | 244,452 | plus14 |
| 2019 to 2020 | 77,608 | minus68 |
| 2020 to 2021 | 325,457 | plus319 |
| 2021 to 2022 | 398,000 | plus22 |
| 2022 to 2023 | 495,537 | plus25 |
| 2023 to 2024 | 332,492 | minus33Tablenote 1 |
|
COVID-19 Travel Restrictions from 2020 to 2022 Based on IRCC's Arrival Projections document, historical data and DAPRU volume statistics reports |
||
| Passenger (air) examination (immigration secondary) | 10 minutesTablenote 1 |
| Study permit (provisionally approved by IRCC) | 8 minutesTablenote 1 |
| Study permit (all others) | 19:45 minutesTablenote 1 |
| Asylum claim (normal processing) | 6 hoursTablenote 2 |
| Asylum claim (One Touch) | 2 hours, 6 minutesTablenote 2 |
| Work permit (provisionally approved by IRCC) | 13 minutesTablenote 1 |
| Work Permit (all others) | 22:56 minutesTablenote 1 |
| Visitor record | 29 minutesTablenote 1 |
| Temporary resident permit | 40 minutesTablenote 1 |
| Allowed to leave | 2 hours, 40 minutesTablenote 1 |
| A44(1) – non refugee | 2 hours, 40 minutesTablenote 1 |
CBSA Mexico asylum claim summary
| Organization and mode | Region | Visa lift (01 Dec 2016 to 29 Feb 2024) |
Visa imposition (01 Mar to 30 Nov 2024) |
Fiscal year 2024 to 2025 (01 Apr to 30 Nov 2024) |
Monthly (01 to 30 Nov 2024) |
|---|---|---|---|---|---|
| CBSA Inland | ATL | 1 | 0 | 0 | 0 |
| QC | 289 | 38 | 36 | 2 | |
| NOR | 17 | 7 | 7 | 2 | |
| GTA | 288 | 107 | 93 | 11 | |
| SOR | 52 | 24 | 23 | 6 | |
| PRA | 3 | 0 | 0 | 0 | |
| PAC | 265 | 68 | 67 | 9 | |
| CBSA Inland total | 915 | 244 | 226 | 30 | |
| CBSA POE | ATL | 13 | 0 | 0 | 0 |
| QC | 30,528 | 252 | 223 | 24 | |
| NOR | 101 | 6 | 1 | 0 | |
| GTA | 5,365 | 43 | 32 | 2 | |
| SOR | 177 | 35 | 35 | 7 | |
| PRA | 643 | 22 | 19 | 2 | |
| PAC | 1,094 | 52 | 45 | 0 | |
| CBSA POE total | 37,921 | 410 | 355 | 35 | |
| IRCC Inland | Eastern | 3,370 | 0 | 0 | 0 |
| Ontario | 2,243 | 0 | 0 | 0 | |
| Western | 5,426 | 0 | 0 | 0 | |
| Unspecified | 2 | 0 | 0 | 0 | |
| Systems | 13,074 | 4,232 | 3,500 | 473 | |
| IRCC total | 24,115 | 4,232 | 3,500 | 473 | |
| CBSA and IRCC total | 62,951 | 4,886 | 4,081 | 538 | |
| Source: CBSA Statistics and Performance Unit | |||||
| Mode | Visa lift (01 Dec 2016 to 29 Feb 2024) |
Visa imposition (01 Mar to 30 Nov 2024) |
Fiscal year 2024 to 2025 (01 Apr to 30 Nov 2024) |
Monthly (01 to 30 Nov 2024) |
|---|---|---|---|---|
| Land BorderTablenote 1 | 994 | 126 | 112 | 12 |
| Airport | 36,905 | 284 | 243 | 23 |
| Inland | 915 | 244 | 226 | 30 |
| Marine | 22 | 0 | 0 | 0 |
| Total | 38,836 | 654 | 581 | 65 |
| Source: CBSA Statistics and Performance Metrics Unit | ||||
| Port of entry | Fiscal year 2024 to 2025 (01 Apr to 30 Nov 2024) |
Monthly (01 to 30 Nov 2024) |
|---|---|---|
| P.E. Trudeau International Airport | 181 | 20 |
| Toronto Pearson International Airport | 32Tablenote 1 | 2Tablenote 2 |
| Saint Bernard de Lacolle | 22 | 4 |
| Pacific Highway | 19 | 0 |
| Vancouver International Airport | 18 | 0 |
| Rainbow Bridge | 12 | 2 |
| Fort Erie | 12Tablenote 3 | 4Tablenote 4 |
| Saint-Armand | 11 | 0 |
| Queenston Lewiston Bridge | 10 | 1 |
| Calgary International Airport | 8 | 1 |
| Stanstead | 7 | 0 |
| Other POEs | 23 | 1 |
| Total | 355 | 35 |
| Source: CBSA Statistics and Performance Metrics Unit | ||
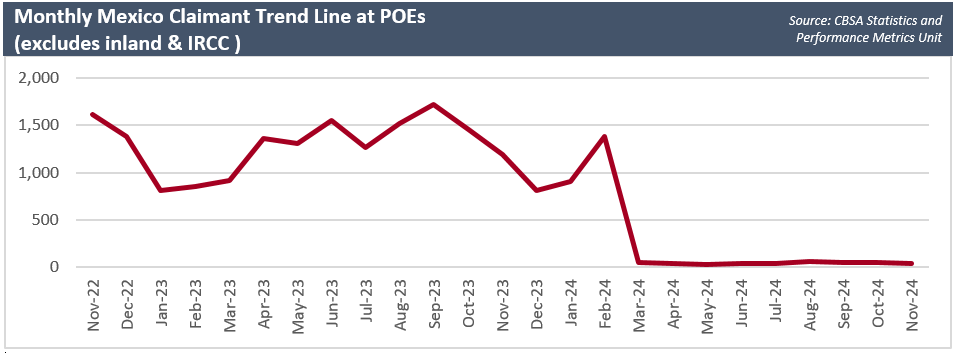
Figure 5 - Text version
| Total | |
|---|---|
| November 2022 | 1,616 |
| December 2022 | 1,377 |
| January 2023 | 813 |
| February 2023 | 855 |
| March 2023 | 919 |
| April 2023 | 1,356 |
| May 2023 | 1,312 |
| June 2023 | 1,555 |
| July 2023 | 1,267 |
| August 2023 | 1,521 |
| September 2023 | 1,725 |
| October 2023 | 1,455 |
| November 2023 | 1,196 |
| December 2023 | 814 |
| January 2024 | 908 |
| February 2024 | 1,377 |
| March 2024 | 55 |
| April 2024 | 40 |
| May 2024 | 32 |
| June 2024 | 44 |
| July 2024 | 41 |
| August 2024 | 66 |
| September 2024 | 48 |
| October 2024 | 49 |
| November 2024 | 35 |
| Source: CBSA Statistics and Performance Metrics Unit | |
| Mode | Regions | Visa lift (01 Dec 2016 to 29 Feb 2024) |
Visa imposition (01 Mar to 30 Nov 2024) |
Fiscal year 2024 to 2025 (01 Apr to 30 Nov 2024) |
Monthly (01 to 30 Nov 2024) |
|---|---|---|---|---|---|
| Inland | ATL | 70 | 9 | 9 | 0 |
| QC | 8,586 | 541 | 385 | 13 | |
| NOR | 361 | 46 | 45 | 4 | |
| GTA | 2,356 | 615 | 477 | 49 | |
| SOR | 493 | 207 | 199 | 30 | |
| PRA | 358 | 83 | 76 | 18 | |
| PAC | 2,357 | 315 | 276 | 19 | |
| Inland total | 14,581 | 1,816 | 1,467 | 133 | |
| POE | ATL | 25 | 5 | 5 | 0 |
| QC | 24,001 | 441 | 369 | 46 | |
| NOR | 137 | 18 | 10 | 0 | |
| GTA | 3,519 | 474 | 363 | 24 | |
| SOR | 256 | 71 | 61 | 15 | |
| PRA | 798 | 29 | 20 | 3 | |
| PAC | 3,368 | 99 | 82 | 4 | |
| POE total | 32,104 | 1,137 | 910 | 92 | |
| CBSA total | 46,685 | 2,953 | 2,377 | 225 | |
| Source: CBSA Statistics and Performance Metrics Unit | |||||
| Visa lift (01 Dec 2016 to 29 Feb 2024) |
Visa imposition (01 Mar to 30 Nov 2024) |
CY 2024 (01 Jan to 30 Nov 2024) |
Monthly (01 to 30 Nov 2024) |
|
|---|---|---|---|---|
| Fraud enquiries | 16,844 | 17 | 324 | 1 |
| Fraud interceptions | 15,377 | 4 | 299 | 0 |
| Source: Weekly Operations Report | ||||
| Regions | Visa lift (01 Dec 2016 to 29 Feb 2024) |
Visa imposition (01 Mar to 30 Nov 2024) |
Fiscal year 2024 to 2025 (01 Apr to 30 Nov 2024) |
|---|---|---|---|
| ATL | 65 | 15 | 14 |
| QC | 2,298 | 194 | 171 |
| NOR | 83 | 105 | 92 |
| GTA | 14,730 | 87 | 70 |
| SOR | 2,023 | 3,683 | 3,250 |
| PRA | 1,835 | 215 | 176 |
| PAC | 9,635 | 1,015 | 899 |
| Total | 30,669 | 5,314 | 4,672 |
| Source: CBSA Data Analytics and Performance Reporting | |||

Figure 6 - Text version
| Inadmissibility Reports | Allowed to Leave | |
|---|---|---|
| November 2022 | 786 | 361 |
| December 2022 | 711 | 288 |
| January 2023 | 978 | 291 |
| February 2023 | 1,115 | 388 |
| March 2023 | 1,266 | 426 |
| April 2023 | 1,175 | 499 |
| May 2023 | 1,930 | 450 |
| June 2023 | 2,258 | 471 |
| July 2023 | 1,957 | 426 |
| August 2023 | 1,992 | 359 |
| September 2023 | 1,180 | 377 |
| October 2023 | 2,138 | 317 |
| November 2023 | 2,130 | 277 |
| December 2023 | 1,551 | 218 |
| January 2024 | 1,655 | 227 |
| February 2024 | 1,858 | 311 |
| March 2024 | 576 | 642 |
| April 2024 | 371 | 395 |
| May 2024 | 304 | 422 |
| June 2024 | 310 | 613 |
| July 2024 | 351 | 1,130 |
| August 2024 | 284 | 799 |
| September 2024 | 218 | 480 |
| October 2024 | 314 | 428 |
| November 2024 | 225 | 405 |
| Source: CBSA | ||
| Permit type | Region | Visa lift (01 Dec 2016 to 29 Feb 2024) |
Visa imposition (01 Mar to 30 Nov 2024) |
Fiscal year 2024 to 2025 (01 Apr to 30 Nov 2024) |
|---|---|---|---|---|
| Visitor Records | ATL | 299 | 30 | 23 |
| QC | 5,545 | 296 | 276 | |
| NOR | 336 | 16 | 14 | |
| GTA | 12,061 | 326 | 306 | |
| NHQ | 4 | 0 | 0 | |
| SOR | 1,062 | 49 | 44 | |
| PRA | 4,550 | 170 | 153 | |
| PAC | 6,891 | 196 | 171 | |
| Unspecified | 2 | 0 | 0 | |
| VR total | 30,750 | VR total | 987 | |
| Study Permits | ATL | 159 | 18 | 17 |
| QC | 4,826 | 383 | 375 | |
| NOR | 248 | 24 | 24 | |
| GTA | 11,466 | 934 | 901 | |
| NHQ | 10 | 0 | 0 | |
| SOR | 986 | 83 | 75 | |
| PRA | 1,914 | 148 | 144 | |
| PAC | 18,979 | 1,658 | 1,553 | |
| Unspecified | 13 | 0 | 0 | |
| SP total | 38,601 | 3,248 | 3,089 | |
| Work Permits | ATL | 3,952 | 594 | 382 |
| QC | 68,108 | 10,077 | 8,662 | |
| NOR | 376 | 85 | 79 | |
| GTA | 128,140 | 15,431 | 13,021 | |
| NHQ | 3 | 0 | 0 | |
| SOR | 1,929 | 196 | 178 | |
| PRA | 9,735 | 638 | 588 | |
| PAC | 72,698 | 7,493 | 5,918 | |
| Unspecified | 49 | 5 | 2 | |
| WP total | 284,990 | 34,519 | 28,830 | |
| Temporary Resident Permits | ATL | 2 | 16 | 12 |
| QC | 68 | 91 | 62 | |
| NOR | 3 | 13 | 2 | |
| GTA | 241 | 92 | 10 | |
| SOR | 21 | 31 | 26 | |
| PRA | 41 | 71 | 27 | |
| PAC | 183 | 243 | 45 | |
| Unspecified | 4 | 0 | 0 | |
| TRP total | 563 | 557 | 184 | |
| Permit total | 354,904 | 39,407 | 33,090 | |
| Source: CBSA Data Analytics and Performance Reporting | ||||
| Mode | Regions | Visa lift (01 Dec 2016 to 29 Feb 2024) |
Visa imposition (01 Mar to 30 Nov 2024) |
Fiscal year 2024 to 2025 (01 Apr to 30 Nov 2024) |
Monthly (01 to 30 Nov 2024) |
|---|---|---|---|---|---|
| Inland | ATL | 23 | 2 | 2 | 0 |
| QC | 2,602 | 167 | 158 | 68 | |
| NOR | 181 | 33 | 31 | 5 | |
| GTA | 1,652 | 145 | 122 | 13 | |
| SOR | 79 | 12 | 11 | 2 | |
| PRA | 595 | 36 | 30 | 1 | |
| PAC | 851 | 58 | 53 | 3 | |
| Inland total | 5,983 | 453 | 407 | 92 | |
| POE | ATL | 4 | 0 | 0 | 0 |
| QC | 1,428 | 32 | 28 | 5 | |
| NOR | 15 | 1 | 1 | 0 | |
| GTA | 154 | 14 | 14 | 1 | |
| SOR | 44 | 6 | 6 | 0 | |
| PRA | 47 | 5 | 5 | 1 | |
| PAC | 2,654 | 34 | 32 | 1 | |
| POE total | 4,346 | 92 | 86 | 8 | |
| CBSA total | 10,329 | 545 | 493 | 100 | |
|
Source: CBSA Statistics and Performance Metrics Unit Note: It can take several years for an inadmissible person to become removal ready; therefore, removals are not reflective of inadmissibility reports. Additionally, some individuals may be subject to multiple inadmissibility reports but would only have one removal. |
|||||
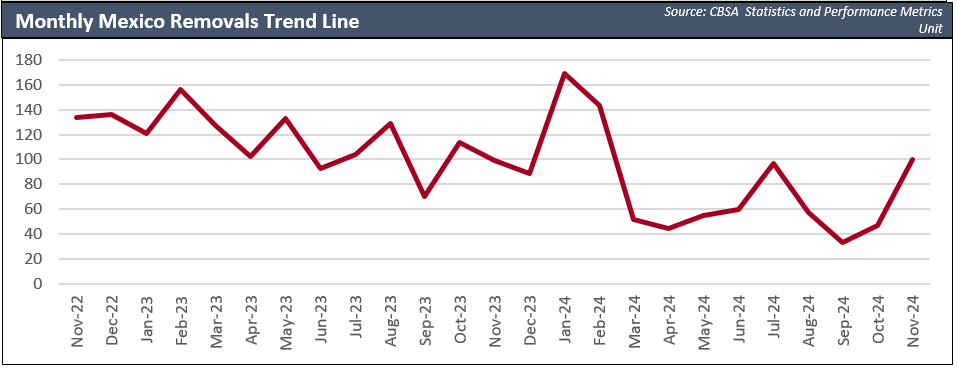
Figure 7 - Text version
| Total | |
|---|---|
| November 2022 | 134 |
| December 2022 | 136 |
| January 2023 | 121 |
| February 2023 | 156 |
| March 2023 | 127 |
| April 2023 | 102 |
| May 2023 | 133 |
| June 2023 | 93 |
| July 2023 | 104 |
| August 2023 | 129 |
| September 2023 | 70 |
| October 2023 | 114 |
| November 2023 | 99 |
| December 2023 | 89 |
| January 2024 | 169 |
| February 2024 | 143 |
| March 2024 | 52 |
| April 2024 | 44 |
| May 2024 | 55 |
| June 2024 | 60 |
| July 2024 | 97 |
| August 2024 | 57 |
| September 2024 | 33 |
| October 2024 | 47 |
| November 2024 | 100 |
| Source: CBSA Statistics and Performance Metrics Unit | |
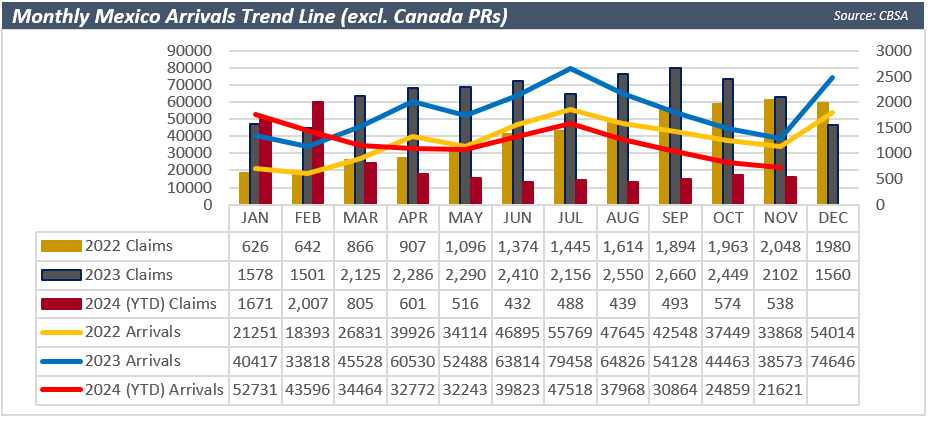
Figure 8 - Text version
| Jan | Feb | Mar | Apr | May | Jun | Jul | Aug | Sep | Oct | Nov | Dec | |
|---|---|---|---|---|---|---|---|---|---|---|---|---|
| 2022 Claims | 626 | 642 | 866 | 907 | 1,096 | 1,374 | 1,445 | 1,614 | 1,894 | 1,963 | 2,048 | 1,980 |
| 2023 Claims | 1,578 | 1,501 | 2,125 | 2,286 | 2,290 | 2,410 | 2,156 | 2,550 | 2,660 | 2,449 | 2,102 | 1,560 |
| 2024 (YTD) Claims | 1,671 | 2,007 | 805 | 601 | 516 | 432 | 488 | 439 | 493 | 574 | 538 | - |
| 2022 Arrivals | 21,251 | 18,393 | 26,831 | 39,926 | 34,114 | 46,895 | 55,769 | 47,645 | 42,548 | 37,449 | 33,868 | 54,014 |
| 2023 Arrivals | 40,417 | 33,818 | 45,528 | 60,530 | 52,488 | 63,814 | 79,458 | 64,826 | 54,128 | 44,463 | 38,573 | 74,646 |
| 2024 (YTD) Arrivals | 52,731 | 43,596 | 34,464 | 32,772 | 32,243 | 39,823 | 47,518 | 37,968 | 30,864 | 24,859 | 21,621 | - |
| Source: CBSA | ||||||||||||
Page details
- Date modified: