
Evaluation of the Buildings and Equipment Program: Management response and action plan and appendices
Recommendations and Management Response and Action Plan
What we found: Performance measurement and reporting
Finding 5: While the Program's performance data and reporting have improved between fiscal year 2018 to 2019 and fiscal year 2021 to 2022, additional improvements and new tools are necessary to ensure data validity and completeness. Data gaps exist due to limited exchanges of information with external stakeholders and inconsistent reporting.
Finding 8: Recent developments in the tracking and disposal of seized goods better support the Program in achieving efficiencies and its environmental sustainability objectives. Additional data could further support the Program in quantifying these efficiencies.
Finding 9: There are many causes that can contribute to lower real property project completion rates. A lack of detailed tracking of project completion timeliness, and of the issues that can cause delays, undermines the Program's ability to effectively manage risks and forecast project timelines.
Finding 12: The CBSA has the highest percentage of custodial facilities in critical condition, relative to OGDs. However, a lack of reporting and data retention prevented an analysis of historical trends.
Finding 13: The Program is limited in its ability to assess asset deterioration in the intermediate and long term due to the deferred maintenance backlog, increases in replacement value, and a lack of reliable data.
Finding 19: While the MAF-reported B&E Program budget and expenditures have increased year-over-year, inconsistencies in how financial data are reported limited an analysis of the Program's funding model.
Recommendation 1: The Vice-President (VP) of FCMB should formalize the performance measurement strategy for the B&E Program, to systematically track progress against key performance indicators (KPI) and fully report on the expected outcomes of the Program. This strategy should formally define the objectives, methodology, and priority areas for data collection, retention, management, and analysis and should include a plan for:
- Data continuity and consistency that supports historical trend analysis
- Inclusion, Equity, Diversity, and Accessibility (IDEA) key performance indicators to support Gender-Based Analysis (GBA) Plus
- Systematic financial data reporting; and
- Consultation with external stakeholders (Public Services and Procurement Canada (PSPC), BGIS, and owners/operators of legislated facilities) to improve data sharing and access
What we found: Program management mechanisms
Finding 6: Existing governance, program, and change management mechanisms highlight the Program's efforts to enhance its business processes and manage risk. However, the evaluation identified gaps and areas for improvement, and certain tools have not been updated in accordance with new TB policies and directives.
Finding 8: Recent developments in the tracking and disposal of seized goods better support the Program in achieving efficiencies and its environmental sustainability objectives. Additional data could further support the Program in quantifying these efficiencies.
Finding 13: The Program is limited in its ability to assess asset deterioration in the intermediate and long term due to the deferred maintenance backlog, increases in replacement value, and a lack of reliable data.
Recommendation 2: The VP of FCMB should conduct a review of, and update, the B&E Program's frameworks and strategies (i.e. the Materiel Management Framework, the CBSA Standard on Fleet Management, the Real Property Management Framework, the Real Property Portfolio Strategy and the B&E Program Risk Profile) to ensure alignment with current Treasury Board policy requirements. As part of this review, the VP of FCMB should ensure the development of a deferred maintenance strategy and should consider census classifications, regional differences, and asset categories when determining replacement and maintenance priorities.
What we found: Resource planning
Finding 15: The Program has demonstrated an ability to address urgent and emerging priorities. However, adapting to meet external challenges and opportunities without a planned and dedicated source of funds, as they arise, may detract from the Program's regular activities.
Finding 16: The National Training Standard (NTS) for Real Property and Accommodations Specialists helps to standardize training needs and expectations for many B&E Program employees. However, low levels of participation in training may affect the Program in meeting client and stakeholder needs, as well as implementing GC priorities, such as Inclusion, Diversity, Equity, and Accessibility (IDEA).
Finding 17: The B&E Program has expanded its staffing complement each year, over four fiscal years. However, Program interviewees and HR data revealed challenges in recruitment and resourcing to meet the demand for specialized skills and expertise. Data inconsistencies limited a quantitative assessment of the impacts on staffing levels.
Finding 18: Aggregate, B&E Program full-time equivalents (FTEs) increased over four fiscal years, with a notable shift towards consolidating Program FTEs within the NRPAD. This is an indication of B&E Program maturation and centralization.
Finding 19: While the MAF-reported B&E Program budget and expenditures have increased year-over-year, inconsistencies in how financial data are reported limited an analysis of the Program's funding model.
Recommendation 3: Given the risk of the relatively high proportion of agency infrastructure in critical condition, the VP of FCMB should review and renew the B&E Program's resource planning strategies to determine present and future needs, to identify gaps, and to ensure that the Program has the capacity to meet its objectives. This review should consider human and financial resources, including the:
- Adequacy of the B&E Program funding profile; and
- Demand for functional and technical expertise amongst real property and materiel management staff (including training and learning, recruitment and retention, and the need for specialized positions)
Management Response and Action Plan
Recommendation 1: Performance measurement and reporting
The Vice-President (VP) of FCMB should formalize the performance measurement strategy for the B&E Program, to systematically track progress against key performance indicators (KPI) and fully report on the expected outcomes of the Program. This strategy should formally define the objectives, methodology, and priority areas for data collection, retention, management, and analysis and should include a plan for:
- Data continuity and consistency that supports historical trend analysis
- Inclusion, Equity, Diversity, and Accessibility (IDEA) key performance indicators to support Gender-Based Analysis (GBA) Plus
- Systematic financial data reporting; and
- Consultation with external stakeholders (Public Services and Procurement Canada (PSPC), BGIS, and owners/operators of legislated facilities) to improve data sharing and access
Management response
The Vice-President, Finance and Corporate Management Branch, agrees with the recommendation and will formalize the performance measurement strategy for the Buildings and Equipment Program to systematically track progress against key performance indicators and fully report on the expected outcomes of the Program. The strategy will address the identified gaps, such as:
- real property financial data
- the implementation of Gender-Based Analysis Plus performance information
- information sharing with Public Services and Procurement Canada building maintenance and
- adoption of Enterprise Project Portfolio Management and Enterprise Asset Management as dedicated Real Property centralized system
| Management action plan | Completion date | Lead | Support |
|---|---|---|---|
1. Conduct brainstorming around a formal definition of the objectives, methodology, and priority areas for continuous and consistent data collection, retention, management, and analysis. |
National Real Property and Accommodations Directorate, Infrastructure Policy Standards and Investments Division |
Results-Based Management and Strategy Division, Enterprise Performance Measurement Unit |
|
2. Develop a Performance Measurement Strategy to track progress against key performance indicators with consideration for GBA+ that will report on the expected outcomes of the Program enabling the agency to report on Treasury Board Secretariat requirements |
National Real Property and Accommodations Directorate, Infrastructure Policy Standards and Investments Division |
Results-Based Management and Strategy Division, Enterprise Performance Measurement Unit Strategic Policy Branch, Gender-Based Analysis Plus |
|
3. Update the Director General approved CBSA Real Property Data Strategy, to include new elements such as:
|
National Real Property and Accommodations Directorate, Infrastructure Policy Standards and Investments Division |
Major Projects Office Custodial Ports of Entry Directorate Agency Comptroller Directorate Public Services and Procurement Canada Planning and Resource Management Directorate, Strategic Finance and Costing |
Recommendation 2: Program management mechanisms
The Vice-President, Finance and Corporate Management Branch, should conduct a review of, and update, the Buildings and Equipment Program's frameworks and strategies (i.e. the Materiel Management Framework, the CBSA Standard on Fleet Management, the Real Property Management Framework, the Real Property Portfolio Strategy and the Buildings and Equipment Program Risk Profile) to ensure alignment with current Treasury Board policy requirements. As part of this review, the Vice-President, Finance and Corporate Management Branch, should ensure the development of a deferred maintenance strategy and should consider census classifications, regional differences, and asset categories when determining replacement and maintenance priorities.
Management response
The Vice-President, Finance and Corporate Management Branch agrees with the recommendation to conduct a review of, and update, the Buildings and Equipment Program's frameworks and strategies including considerations relating to the Land Border Crossing Project.
| Management action plan | Completion date | Lead | Support |
|---|---|---|---|
1. Update the Real Property Portfolio Strategy, including Land Border Crossing Project Port of Entry replacement priorities and ensure alignment with current Treasury Board policy requirements. |
RP Portfolio Strategy: National Real Property and Accommodations Directorate, Infrastructure Policy Standards and Investments Division Land Border Crossing Project Port of Entry replacement priorities: Major Projects Office, Custodial Ports of Entry Directorate |
|
|
2. Update the Materiel Management Directive establishing a framework for asset management and ensure alignment with current Treasury Board policy requirements. |
National Real Property National Real Property |
|
|
3. Update Materiel Management Strategic Fleet Greening Plan and ensure alignment with current Treasury Board policy requirements. |
National Real Property National Real Property |
|
|
4. Update the Real Property Management Framework and ensure alignment with current Treasury Board policy requirements such as the 2022 directive on the management of real property. |
National Real Property |
|
|
5. Update approach for calculating CBSA Real Property Portfolio deferred maintenance based on building assessments, building maintenance plans, and investment analysis reports. |
National Real Property |
Major Projects Office Custodial Ports of Entry Directorate |
|
6. Update the Building and Equipment Program Risk Profile identifying major threats to the delivery of the program commitments and ensure alignment with current Treasury Board policy requirements such as the 2022 directive on the management of real property |
National Real Property |
Major Projects Office, Custodial Ports of Entry Directorate |
Recommendation 3: Resource planning
Given the risk of the relatively high proportion of agency infrastructure in critical condition, the Vice-President, Finance and Corporate Management Branch, should review and renew the Buildings and Equipment Program's resource planning strategies to determine present and future needs, to identify gaps, and to ensure that the Program has the capacity to meet its objectives. This review should consider human and financial resources, including the:
- Adequacy of the Buildings and Equipment Program funding profile; and
- Demand for functional and technical expertise amongst real property and materiel management staff (including training and learning, recruitment and retention, and the need for specialized positions)
Management response
The Vice-President, Finance and Corporate Management Branch, agrees to review the program resource planning strategies to determine present and future needs, to identify priorities and gaps, and to ensure that the Program has the capacity to meet its objectives. The Building and Equipment program will leverage the annual integrated business planning process and a reviewed governance framework (Real Property Management Framework) to prioritize real property investments and to mitigate the risks associated with the delivery of the program commitments. The program resource allocation process will also benefit from the real property financial data consolidation and consultations with external partners on building condition assessments, as referred to in the MRAP action item #2 for recommendation 1.
| Management action plan | Completion date | Lead | Support |
|---|---|---|---|
1. Propose opportunities to seek additional sources of funds to advance the Building and Equipment Program objectives. |
National Real Property Major Projects Office, Custodial Ports of Entry Directorate |
Finance and Corporate Management Branch, Strategic Finance and Costing |
|
2. Deliver annual updates to the National Real Property and Accommodations and Major Projects Office Custodial Ports of Entry integrated business plans, identifying the Program's funding needs and implications as well as the program's needs and opportunities related to recruitment, training and maintaining specialized technical resourcing levels and update the program risk profile (refer to action item #6 from recommendation 2) accordingly |
National Real Property Major Projects Office Custodial Ports of Entry Directorate |
|
Appendices
Appendix A: Acronyms and definitions
- AMP
- Asbestos Management Plan
- BGIS
- Brookfield Global Integrated Solutions
- BSO
- Border Service Officers
- BCR
- Building Condition Report
- B&E
- Buildings and Equipment
- DSDS
- Departmental Sustainable Development Strategy
- DFRP
- Directory of Federal Real Property
- EMC
- Emergency Management Committee
- EO
- Environmental Operations
- FCMB
- Finance and Corporate Management Branch
- FMM
- Functional Management Model
- FIMC
- Financial and Investment Management Committee
- FUFA
- Fit-Up and Funding Accountabilities
- FTE
- Full Time Equivalent
- GBA Plus
- Gender-Based Analysis Plus
- IBP
- Integrated Business Plan
- IDEA
- Inclusion, Diversity, Equity, Accessibility
- KPI
- Key Performance Indicator
- LBCP
- Land Border Crossing Project
- MAF
- Management Accountability Framework
- NRPAD
- National Real Property and Accommodation
- MOU
- Memorandum of Understanding
- NTS
- National Training Standard
- OECM
- Other Effective Area-Based Conservation Measures
- OGD
- Other Government Departments
- O&M
- Operations and Maintenance
- PIP
- Performance Information Profile
- POE
- Port of Entry
- PoW
- Program of Work
- PSPC
- Public Services and Procurement Canada
- SDG
- Sustainable Development Goal
- TB
- Treasury Board
- TBS
- Treasury Board Secretariat
- USS
- Uniform Supply System
- Category 3 vehicles
- Specialty vehicles are standard vehicles assigned to a specific function, but without any specialty equipment installed.
- Category 4 vehicles
- General administrative vehicles are standard vehicles for general use, with no specific function and no specialty equipment.
- CBSA custodial buildings
- Custodial facilities refer to the inventory of Federal Real Property that is under the administration of the Minister of Public Safety and Emergency Preparedness and for which the CBSA has full life-cycle responsibilities.
- Fit-Up and Funding Accountabilities (FUFA)
- An evergreen statement of responsibility between owners/operators and the CBSA that outlines construction, installation, replacement, and maintenance for components at legislated facilities.
- Isolated areas
- According to the Treasury Board (TB) Directory of Federal Real Property (DFRP), this includes "all Census subdivisions that are not considered as Urban or Rural. These are census subdivisions with a population density less than 1 person per square kilometre." As of 2022, Statistics Canada no longer uses this definition. Census classification areas comprise population centres (small, medium, large) and rural areas.
- Leased buildings
- Facilities administered by Public Services and Procurement Canada.
- Legislated facilities
- Owners and operators of infrastructure that receive imported goods are required by law to provide, at no cost, space for detention and examination, where warranted, of persons or goods entering Canada. These facilities are legislated under Section 6 of the Customs Act.
- One-year appropriations
- Appropriations made for a specified fiscal year and that are available for obligation only during the fiscal year for which made. Funds expire after one year and are no longer available to incur new obligations.
- Over-programming
- When a Program constructs its approved, capital investment so that the planned expenditure in each year exceeds the available budget. Underspending can cause Program inefficiencies and challenges. To account for planning difficulties encountered by the Program, such as delays in project completion, over-programming supports risk management and allows the Program to fully benefit from its budget.
- Program FTEs
- Full-time equivalents that contribute to Buildings and Equipment activities under the same cost centre, as referenced in finding 24.
- Rural areas
- According to the TB DFRP, this includes "census subdivisions that are not Urban and have a population density greater or equal to 1 person per square kilometre."
- SAP
- A procurement tool used by the CBSA that is designed to support supplier management, spending management, contract lifecycle management, and accounts payable.
- Urban areas
- According to the TB DFRP, this includes "areas with a population of at least 1,000 and no fewer than 400 persons per square kilometre." As of 2022, Statistics Canada classifies this as a "population centre," that is either small, medium, or large.
Appendix B: B&E Program logic model
CBSA's mandate: The agency is responsible for providing integrated border services that support national security and public safety priorities and facilitate the free flow of persons and goods, including animals and plants, that meet all requirements under program legislations.
Program outcomes
- Ultimate: CBSA's infrastructure and equipment are suitable, sustainable, safe, resilient and operational to enable border service delivery
- Intermediate
- Agency infrastructure and equipment are managed effectively throughout their life cycle
- Infrastructure and equipment are operational and available for use by the CBSA
- Crown-owned assets condition are adequate
- Program activities are conducted in an environmentally safe and sustainable manner
- Immediate:
- Robust business processes supporting fixed and movable assets investment decisions (under intermediate outcome #1)
- Infrastructure and equipment are maintained to meet CBSA needs and standards. (under intermediate outcome #2)
- Client and stakeholder relationships are managed effectively (under intermediate outcome #2)
- Crown-owned assets are renewed and renovated to meet CBSA needs and standards (under intermediate outcome #3)
- Health, safety, and environmental risks are mitigated through comprehensive and appropriate interventions (under intermediate outcome #4)
- Infrastructure and equipment are managed in an environmentally sustainable manner (under intermediate outcome #4)
Outputs
- Intermediate outcome #1
- Real property policies, standards frameworks and directives delivered
- Periodic program evaluation
- Integrated Business Plan, RP Investment Plan, Asset Management Plan
- Evidence based governance board decisions
- Enterprise Asset Management digital solutions for asset life-cycle management
- Life cycle management reports
- Program performance and risk assessments
- Intermediate outcome #2
- Operation and maintenance activities carried out
- Acquisition, deployment and disposal of non-capitalized assets
- Maintenance and risk mitigation activities carried out at legislated facilities
- Building Maintenance and Risk Assessments
- Statement of responsibility between the CBSA and legislated facilities
- Intermediate outcome #3
- Acquisition, deployment and disposal of capital assets
- Renewed and renovated facilities and updated materiel
- Building Condition Reports and Operational Statement of Requirements
- Intermediate outcome #4
- Departmental Sustainable Development Strategy deployed
- Strategic Environmental Assessments
- Environmental legislation compliance
- Environmental health and safety promotion
- Federal lands and local ecosystems protected
- Reduced greenhouse gas emissions and improved climate resiliency
- Resources conservation and reduced waste to landfill
Activities
- Intermediate outcome #1: Program Management & Program Governance
- Intermediate outcome #2 and #3: Program Delivery Activities
- Intermediate outcome #4: Environmental Sustainability Activities
- All outcomes fall within Life-cycle Management of Fixed and Movable Assets activities
Appendix C: Detailed evaluation scope
The evaluation employed a mixed-methods research approach. The specific evaluation questions included:
Theme 1: Relevance (Program mission and strategy)
- To what extent are the B&E Program mandate, roles, responsibilities, and priorities, as currently stated, aligned with FCMB, CBSA, GC priorities and objectives?
- To what extent has the B&E Program adapted its activities, outputs, and outcomes to align with changes in Treasury Board policy, as part of ongoing Treasury Board Policy Modernization efforts?
- To what extent do program representatives, clients, and stakeholders have a clear understanding of the objectives and roles and responsibilities of the B&E Program (e.g. program structure, policies and procedures, activities and outputs, outcomes)?
Theme 2: Effectiveness (Program design, achievement of outcomes, and performance measurement)
- To what extent are the program's logic model and expected outcomes realistic, clear, and measurable? To what extent are performance data, measurement, and reporting mechanisms available, sufficient, and of good quality?
- To what extent has the Program achieved its immediate intended outcomes?
- How effective are the existing governance, project, and change management mechanisms for identifying/mitigating risk?
- What external environmental challenges and opportunities exist and how has the program responded?
Theme 3: Efficiency (Resources and resource planning)
- To what extent do the Program's investment planning, maintenance, and risk mitigation activities support efficient delivery of other program activities and outcomes?
- Does the B&E Program resourcing model support program stability and address emerging needs?
- To what extent has the B&E Program addressed any human resources challenges, supported its staff, and addressed the factors that affect their work?
- To what extent do program resources enable effective and efficient delivery of the B&E Program activities and immediate outcomes?
Elements fully out of scope and justification
Intermediate and ultimate program outcomes: As the Program is relatively new in its current structure (fiscal year 2019 to 2020), this evaluation is formative and it may be premature to assess the achievement of these outcome levels.
Detection technology field support and detection science technology: Assessed as part of the Evaluation of Field Technology Support (FTS), 2019. A previous recommendation related to detection technology procurement and management was identified in the Evaluation of FTS.
CCTV: Assessed as part of the Evaluation of FTS, 2019. A previous recommendation related to CCTV procurement and management was identified in the Evaluation of FTS (closed in Q2 2020 to 2021).
Land Border Crossing Project, the Gordie Howe International Bridge, and other major projects delivery: These elements fall within the Major Projects Office, Custodial Ports of Entry Directorate's area of responsibility, until the projects have been delivered and are transferred to NRPAD for maintenance/lifecycle management.
HQ accommodations and infrastructure: Given the size and complexity of the current evaluation scope, this element may warrant a separate evaluation assessment.
International vehicles and uniforms for personnel working overseas: These elements are primarily the responsibility of Global Affairs Canada.
Elements partially out of scope and justification
Radio equipment and technology: The agency is in the process of clarifying roles and responsibilities and OPIs, and developing procurement strategies. These elements are managed by the ISTB. There may be an opportunity to examine the clarity of the roles and responsibilities surrounding them.
Third-party facilities that are not legislated under Section 6 of the Customs Act, such as postal facilities and sufferance warehouses: These facilities are not within the area of responsibility of the B&E Program. However, there will be an opportunity to examine the clarity of the roles and responsibilities surrounding this element.
Appendix D: B&E Program governance bodies
| Meeting | Purpose | Frequency | Lead | Audience |
|---|---|---|---|---|
Technical Review sub-committee This committee was suspended |
Projects are analysed and recommended for approval from a technical perspective. Operational in nature. |
Monthly meetings and ad-hoc |
DG NRPAD |
Agency management |
Multi-regional meeting |
To provide updates and status reports on advancement of programs and projects, as well as updates from finance. |
Monthly |
DG NRPAD |
Regional and HQ representatives (project managers) |
Project management meetings |
Regular operational level meetings concerning project management and project oversight. |
Monthly meetings and ad-hoc |
N/A |
Regional and HQ |
Priority review |
Management meeting to spot check projects, update financing status. |
Quarterly meeting |
DG NRPAD |
Regional and HQ representatives (project managers) |
Appendix E: NRPAD reporting structure
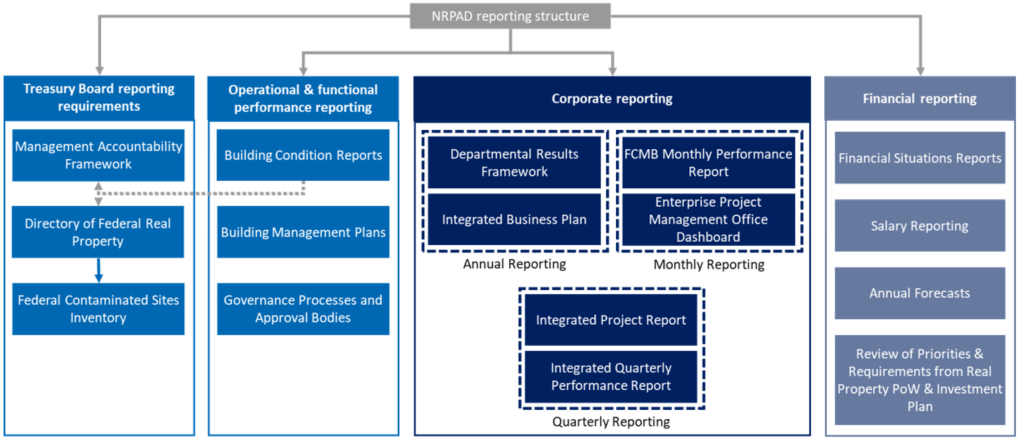
Figure 5 - Text version
The following image showcases the National Real Property and Accommodations Directorate (NRPAD) reporting structure. The structure consists of four primary branches, which are: Treasury Board reporting requirements, Operational & functional performance reporting, Corporate reporting and Financial reporting. Firstly, under the Treasury Board reporting requirements Branch is the management accountability framework, directly underneath is the directory of federal real property which has underneath it the federal contaminated sites inventory. This image is showcasing a reporting obligation from top to bottom starting with the Treasury board reporting requirements until the federal contaminated sites inventory.
Secondly, under the Operational & functional performance reporting branch there is the building condition reports, which is also linked to column 1 with the management accountability framework and the directory of federal real property. Underneath the building condition reports is the building management plans which has underneath it the governance process and approval bodies. This image showcases the reporting obligation from top to bottom starting with the operational & functional performance until the governance and approval bodies. Both columns 1 and 2 which consists of the treasury board reporting requirements and the operational & functional performance reporting are colored light blue which indicates a reporting relationship between both branches.
Thirdly, under the corporate reporting branch there are three sub groups for (1) annual reporting, (2) monthly reporting and (3) quarterly reporting which consists of ; departmental results framework and integrated business plan, FCMB monthly performance report and enterprise project management office dashboard, integrated project report and integrated quarterly performance report. This structure is in dark blue to indicate its own reporting structure, separate from the other branches in the image.
Lastly, under the financial reporting branch there is the financial situations reports. Underneath the financial situations report there is the salary reporting which has underneath it the annual forecasts. At the bottom of the reporting column for this branch is the review of priorities & requirements from real property PoW & investment plan. This branch is colored gray to indicate its own reporting structure not related to the other branches.
Appendix F: Real property project completion
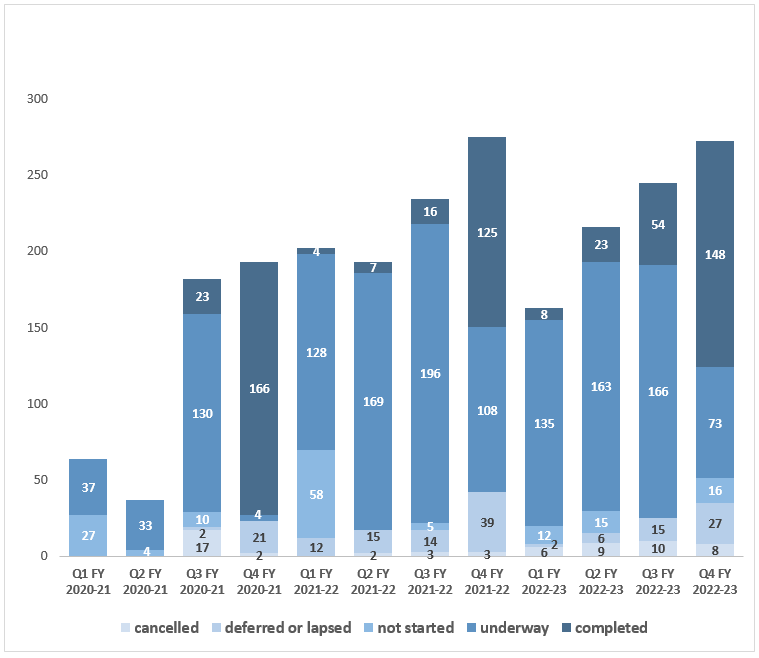
Figure 6 - Text version
| Fiscal year 2020 to 2021 | Fiscal year 2021 to 2022 | Fiscal year 2022 to 2023 | ||||||||||
|---|---|---|---|---|---|---|---|---|---|---|---|---|
| Q1 | Q2 | Q3 | Q4 | Q1 | Q2 | Q3 | Q4 | Q1 | Q2 | Q3 | Q4 | |
| completed | 0 | 0 | 23 | 166 | 4 | 7 | 16 | 125 | 8 | 23 | 54 | 148 |
| underway | 37 | 33 | 130 | 4 | 128 | 169 | 196 | 108 | 135 | 163 | 166 | 73 |
| not started | 27 | 4 | 10 | 0 | 58 | 0 | 5 | 0 | 12 | 15 | 0 | 16 |
| deferred or lapsed | 0 | 0 | 2 | 21 | 12 | 15 | 14 | 39 | 2 | 6 | 15 | 27 |
| cancelled | 0 | 0 | 17 | 2 | 0 | 2 | 3 | 3 | 6 | 9 | 10 | 8 |
Source: FCMB, NRPAD data, fiscal year 2020 to 2021 to fiscal year 2022 to 2023.
(*) projects include POW, EO, and CCTV
- Completed: Started and finished within the PoW
- Underway: Identified in the PoW and the work has started
- Not started: Identified in the PoW, but not started and awaiting approval to commence
- Deferred: Submitted for inclusion in the PoW, but deferred (to either a later date or fiscal year) due to unforeseen circumstances and/or for planning purposes
- Lapsed: Submitted for inclusion in the PoW, and is ongoing, (not cancelled), but moved to a different source of funding. The scope of the project may have also changed and needs to be re-evaluated
- Cancelled: Submitted for inclusion in the PoW, but forced to shut down
Appendix G: CBSA building conditions
CBSA custodial facility condition by province, by census classification, and condition
| Building condition | Census classification | |||
|---|---|---|---|---|
| Isolated | Rural | Urban | Grand total | |
| Critical | 10 | 3 | 0 | 13 |
| Poor | 6 | 0 | 0 | 6 |
| Fair | 0 | 6 | 0 | 6 |
| Good | 4 | 7 | 0 | 11 |
| Grand total | 20 | 16 | 0 | 36 |
|
Source: DFRP building condition report, 2023. |
||||
| Building condition | Census classification | |||
|---|---|---|---|---|
| Isolated | Rural | Urban | Grand total | |
| Critical | 4 | 10 | 0 | 14 |
| Poor | 2 | 6 | 0 | 8 |
| Fair | 0 | 13 | 0 | 13 |
| Good | 9 | 7 | 0 | 16 |
| Grand total | 15 | 36 | 0 | 51 |
|
Source: DFRP building condition report, 2023. |
||||
| Building condition | Census classification | |||
|---|---|---|---|---|
| Isolated | Rural | Urban | Grand total | |
| Critical | 5 | 2 | 4 | 11 |
| Poor | 0 | 14 | 0 | 14 |
| Fair | 7 | 1 | 0 | 8 |
| Good | 7 | 31 | 2 | 40 |
| Grand total | 19 | 48 | 6 | 73 |
|
Source: DFRP building condition report, 2023. |
||||
| Building condition | Census classification | |||
|---|---|---|---|---|
| Isolated | Rural | Urban | Grand total | |
| Critical | 15 | 2 | 0 | 17 |
| Poor | 16 | 0 | 0 | 16 |
| Fair | 5 | 0 | 0 | 5 |
| Good | 11 | 9 | 0 | 20 |
| Grand total | 47 | 11 | 0 | 58 |
|
Source: DFRP building condition report, 2023. |
||||
| Building condition | Census classification | |||
|---|---|---|---|---|
| Isolated | Rural | Urban | Grand total | |
| Critical | 1 | 3 | 0 | 4 |
| Poor | 1 | 9 | 0 | 10 |
| Fair | 2 | 9 | 0 | 11 |
| Good | 0 | 5 | 0 | 5 |
| Grand total | 4 | 26 | 0 | 30 |
|
Source: DFRP building condition report, 2023. |
||||
| Building condition | Census classification | |||
|---|---|---|---|---|
| Isolated | Rural | Urban | Grand total | |
| Critical | 17 | 0 | 0 | 17 |
| Poor | 20 | 0 | 0 | 20 |
| Fair | 32 | 0 | 0 | 32 |
| Good | 23 | 1 | 0 | 24 |
| Grand total | 92 | 1 | 0 | 93 |
|
Source: DFRP building condition report, 2023. |
||||
| Building condition | Census classification | |||
|---|---|---|---|---|
| Isolated | Rural | Urban | Grand total | |
| Critical | 2 | 0 | 0 | 2 |
| Poor | 1 | 1 | 0 | 2 |
| Fair | 6 | 6 | 1 | 13 |
| Good | 0 | 6 | 1 | 7 |
| Grand total | 9 | 13 | 2 | 24 |
|
Source: DFRP building condition report, 2023. |
||||
| Building condition | Census classification | |||
|---|---|---|---|---|
| Isolated | Rural | Urban | Grand total | |
| Critical | 0 | 0 | 0 | 0 |
| Poor | 3 | 0 | 0 | 3 |
| Fair | 8 | 0 | 0 | 8 |
| Good | 16 | 0 | 0 | 16 |
| Grand total | 27 | 0 | 0 | 27 |
|
Source: DFRP building condition report, 2023. |
||||
CBSA custodial facility condition by province/territory
| Floor area | Count of buildings | |
|---|---|---|
| Saskatchewan | 1360 | 17 |
| Quebec | 9208 | 17 |
| Manitoba | 750 | 14 |
| Alberta | 966 | 13 |
| British Columbia | 6003 | 11 |
| New Brunswick | 879 | 4 |
| Ontario | 88 | 2 |
| Yukon | 0 | 0 |
| Total | 19,254 | 78 |
|
Saskatchewan and Quebec had the greatest number of buildings identified to be in critical condition, each comprising 21.7% of all critical condition buildings. Source: DFRP building condition report, 2023. |
||
| Floor area | Count of buildings | |
|---|---|---|
| Quebec | 2774 | 20 |
| Saskatchewan | 1845 | 16 |
| British Columbia | 2224 | 14 |
| New Brunswick | 2365 | 10 |
| Manitoba | 581 | 8 |
| Alberta | 295 | 6 |
| Yukon | 955 | 3 |
| Ontario | 81 | 2 |
| Total | 11,120 | 79 |
|
Quebec had the greatest number of buildings identified to be in poor condition, comprising 25.3% of all buildings in poor condition. Source: DFRP building condition report, 2023. |
||
| Floor area | Count of buildings | |
|---|---|---|
| Quebec | 29818 | 32 |
| Ontario | 1633 | 13 |
| Manitoba | 3909 | 13 |
| New Brunswick | 3411 | 11 |
| British Columbia | 1016 | 8 |
| Yukon | 898 | 8 |
| Alberta | 1340 | 6 |
| Saskatchewan | 418 | 5 |
| Total | 42,443 | 96 |
|
Quebec had the greatest number of buildings in fair condition, representing 33.3% of all buildings in fair condition. Source: DFRP building condition report, 2023. |
||
| Floor area | Count of buildings | |
|---|---|---|
| British Columbia | 26505 | 40 |
| Quebec | 37472 | 24 |
| Saskatchewan | 3286 | 20 |
| Yukon | 1729 | 16 |
| Manitoba | 4151 | 16 |
| Alberta | 4174 | 11 |
| Ontario | 3809 | 7 |
| New Brunswick | 5760 | 5 |
| Total | 86,886 | 139 |
|
British Columbia had the greatest number of buildings in good condition, comprising 28.8% of all buildings in good condition. Source: DFRP building condition report, 2023. |
||
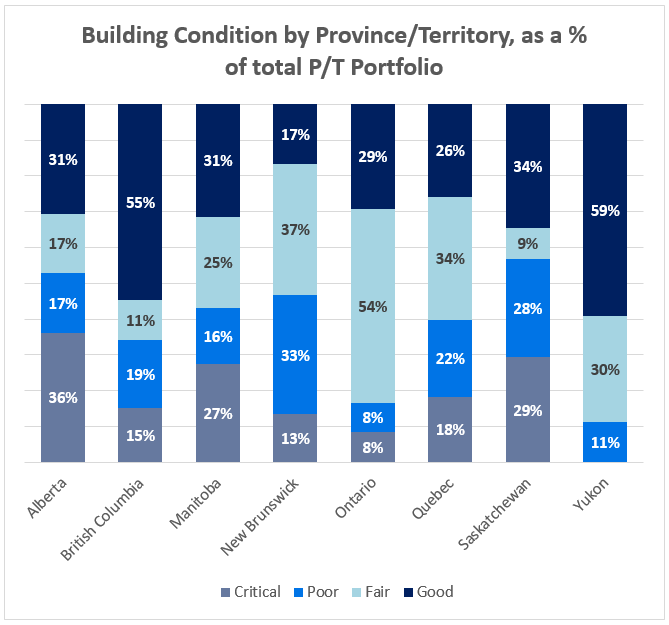
Figure 7 - Text version
| Critical | Poor | Fair | Good | |
|---|---|---|---|---|
| Alberta | 36% | 17% | 17% | 31% |
| British Columbia | 15% | 19% | 11% | 55% |
| Manitoba | 27% | 16% | 25% | 31% |
| New Brunswick | 13% | 33% | 37% | 17% |
| Ontario | 8% | 8% | 54% | 29% |
| Quebec | 18% | 22% | 34% | 26% |
| Saskatchewan | 29% | 28% | 9% | 34% |
| Yukon | 0% | 11% | 30% | 59% |
Source: DFRP building condition report, 2023.
The Yukon had the greatest percentage of its custodial facility portfolio identified to be in good condition at 59%, representing 16 of its total 27 buildings.
British Columbia closely followed, with 55% of its custodial facility portfolio being identified to be in good condition, representing 40 of its 73 total buildings.
Conversely, New Brunswick had the smallest percentage of its custodial facilities in good condition, with just 17% of buildings identified to be in good condition. This represented 5 of its 30 custodial buildings.
Regions of potential concern
Alberta had the largest percentage of its custodial facility portfolio identified to be in critical condition, at 36%. This represented 13 of its 36 total facilities. This could point to shortcomings in the maintenance of Alberta-based custodial facilities.
As of , the Yukon had no facilities identified to be in critical condition.
Appendix H: Replacement cost by asset category
| Canopy | Garage | Housing | Main | Residence | Warehouse | Commercial | |
|---|---|---|---|---|---|---|---|
| 2022 | $11,139 / sq. meter. $2,720,162 |
$11,139 / sq. meter. $141,157,116 |
$14,622 / sq. meter. $105,208,706 |
$19,717 / sq. meter. $2,372,094,704 |
$14,622 / sq. meter. $146,272,271 |
$11,139 / sq. meter. $77,067,346 |
$9,219 / sq. meter. $139,113,346 |
| 2021 | $9,361 / sq. meter. $2,059,312 |
$9,361 /sq. meter. $103,324,118 |
$13,872 / sq. meter. $98,007,302 |
16,569 / sq. meter. $1,760,780,842 |
$13,872/ sq. meter. $125,072,021 |
$9,361 / sq. meter. $43,114,509 |
$7,747 / sq. meter. $108,514,793 |
| % increase in total value | 32.1% | 36.6% | 7.4% | 34.7% | 17.0% | 78.8% | 28.2% |
| % increase in average value | 19.0% | 19.0% | 5.4% | 19.0% | 5.4% | 19.0% | 19.0% |
|
Source: FCMB, RPAD DFRP Replacement Value Table, 2022 This information is not currently used to make decisions on deferred maintenance and replacement. However, replacement costs by asset category could, in tandem with other criteria identified by the B&E Program to be of importance, support the improved maintenance of custodial facilities. |
|||||||
Appendix I: Environmental sustainability targets
Fleet acquisition target
During the period covered by this evaluation, the B&E Program successfully met and surpassed its DSDS target. The B&E Program has increased the percentage of new Category 3 and 4 vehicles (Appendix A) that are hybrid electric vehicles and zero-emissions vehicles (including HEVs, PHEVs, BEVs, and FCEVs). In turn, the Program successfully met and surpassed the 75% purchasing quota outlined in the CBSA's 2020 to 2023 DSDS.
The continued transition towards a hybrid and zero-emissions fleet will help the CBSA in reaching its target of a 40% reduction in GHG emissions below 2005 to 2006 levels. The 75% HEV/ZEV purchase quota was expanded to all Categories (1-4) of vehicles in .
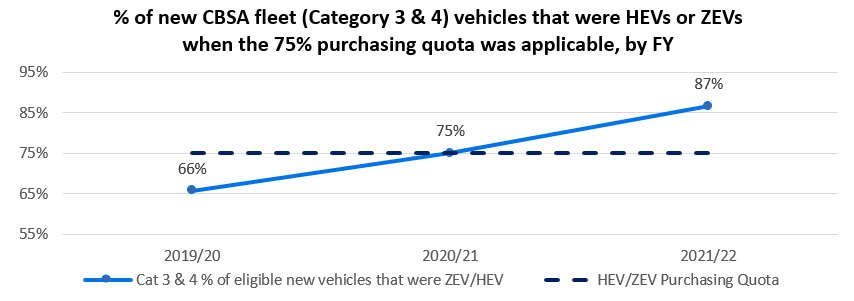
Figure 8 - Text version
| 2019 to 2020 | 2020 to 2021 | 2021 to 2022 | |
|---|---|---|---|
| Cat 3 & 4 % of eligible new vehicles that were ZEV/HEV | 66% | 75% | 87% |
| HEV/ZEV Purchasing Quota | 75% | 75% | 75% |
Source: Land Vehicles Greening Government Report, 2019 to 2020.
Source: Conventional Land Vehicle Fleet Inventory, 2020 to 2021.
Source: Federal Conventional Land Vehicle Greening Government Report, 2021 to 2022.
The Program's ongoing efforts to procure HEV/ZEV alternatives to conventional combustion vehicles demonstrates direct alignment with SDG 13 on climate action.

Figure 9 - Text version
| 2019 to 2020 | 2020 to 2021 | 2021 to 2022 | |
|---|---|---|---|
| Combined % of Fleet that is ZEV only (end of fiscal) | 1% | 2% | 4% |
| 2030 Target | 80% | 80% | 80% |
Source: Land Vehicles Greening Government Report, 2019 to 2020.
Source: Conventional Land Vehicle Fleet Inventory, 2020 to 2021.
Source: Federal Conventional Land Vehicle Greening Government Report, 2021 to 2022.
Over four fiscal years, the CBSA has been working towards a fleet consisting of 80% zero emissions vehicles (ZEVs) by 2030. Considering current fleet replacement trends, this goal may not be realistic. The most recent fleet inventories indicate that the CBSA's Category 3 and 4 fleets comprise only 4% of all Category 3 and 4 vehicles. Notably, the 80% target increased in to 100% of the fleet being ZEVs by 2030.
Appendix J: GBA Plus case study – CBSA uniforms
In 2020, Travellers Branch made updates to the CBSA Uniform Policy and Standards of Appearance. Certain changes reflected the agency's commitment to aligning with Treasury Board policy modernization and GC priorities.
The outcomes of collaboration demonstrated the benefits of reaching out to identify the interests and concerns of equity-deserving groups.
These outcomes included:
- The development of new commemorative pin designs: These further promote employees' ability to reflect support for interests that matter to Canadians
- Changes to the Uniform Supply System (USS): Until recently, the uniform supplier for the CBSA Uniform Issuance and Policy Unit used a binary approach to gender in their uniform component descriptions
Groups consulted included:
- The Women's Advisory Network
- The 2SLGBTQI+ Advisory Committee
- The Persons With Disabilities Advisory Committee (PDAC)
Key updates to the Uniform Supply System (USS):
- All uniformed employees have the option to select fit components designated as male and/or female in the USS catalogue. This change was made to respect diversity of gender expression for employees
- Cup size for soft body armour is now an optional measurement, to reflect that it is not always required (not all female-identified officers choose this, garment that was previously considered part of the category "female")
- A Consent Based Measurement system for uniform components has been developed. This can help promote uniformed employees' safety, dignity and respect
Opportunities for further improvement:
- Changes like moving away from binary understandings of gender take time. For example, data on BSO Employees' uniform component orders is still limited by the binary options of gender self-identification
- Addressing other concerns like Accessibility will likely benefit from additional consultations and research
Appendix K: Biodiversity efforts
B&E's recent OECM land commitment to the Canadian Protected and Conserved Area database is in direct alignment with SDG 15 regarding life on land.
Greening Government Strategy
The Greening Government Strategy commits federal organizations to:
- Identify any federal Crown lands or waters that could contribute to the commitment to conserve and protect 25% of Canada's land and oceans (working toward 30% by 2030) through low to no-cost designation or OECMs
- Develop management approaches as required for federal sites to protect biodiversity and enable sites to be recognized as protected areas or OECMs
CBSA's Contributions
The CBSA's Rigaud campus OECM parcel of land will contribute roughly 8.45 hectares to the Canadian Protected and Conserved Area Database. This land acts as a valuable ecological corridor for wildlife to safely navigate the surround land.
The CBSA has had consultations with ECCC, installed outdoor signage notifying visitors of prohibited activities, engaged internal stakeholders regarding CBSA biodiversity commitments, and successfully screened the property as an OECM candidate.
Rigaud Next Steps
- Continue engagement with the Indigenous communities
- Complete a wildlife study to confirm the presence of species at risk (fiscal year 2024 to 2025)
- Include species conservation plans in the OECM site management plan
- Continue to support biodiversity and identify opportunities to enhance, restore, or protect critical habitat
Appendix L: B&E Program full-time equivalents
| 2018 to 2019 | 2019 to 2020 | 2020 to 2021 | 2021 to 2022 | |
|---|---|---|---|---|
| B&E - Asset Management | - | - | - | 0.01 |
| B&E– Real Property Resource Management | 3.42 | 10.46 | 17.56 | - |
| B&E– Real Property EO & Sustainable Development | 2.19 | 16.83 | 10.41 | 13.53 |
| B&E – Real Property Operating and Maintaining Delivery | 14.83 | 21.19 | 25.87 | 25.33 |
| B&E – Management and Oversight | 5.65 | 6.49 | 9.77 | - |
| B&E – Management and Oversight (Management and DO Staff) | - | - | - | 11.96 |
| B&E – Program Support and Policy Development | 19.49 | 6.11 | 9.17 | 10.18 |
| B&E – Real Property Project Delivery | 6.32 | 12.00 | - | - |
| B&E– Uniform Issuance & Policy | 15.36 | 16.50 | 15.08 | 15.40 |
| B&E– Emergency Management Section | 0.01 | 8.40 | 7.69 | - |
|
Source: FCMB, NRPAD FTE Data, fiscal year 2018 to 2019 to fiscal year 2021 to 2022. |
||||
Two branches, four directorates, and seventeen divisions from the Regions and HQ contributed to the total Program FTEs of B&E activities in fiscal year 2022 to 2023.
Some FTEs, namely in the Uniform Issuance and Policy Unit under Travellers Branch, remain outside the FCMB framework.
B&E Real Property Operating & Maintaining Delivery represented the highest number of Program FTEs, most recently representing 25.33 FTEs or 33.15% of all program FTEs in fiscal year 2021 to 2022.
B&E Asset Management and B&E Management & Oversight launched in fiscal year 2021 to 2022 and collectively accounted for roughly 12 FTEs contributing to B&E activities that fiscal year.
Appendix M: B&E Program expenditures

Figure 10 - Text version
| 2018 to 2019 | 2019 to 2020 | 2020 to 2021 | 2021 to 2022 | |
|---|---|---|---|---|
| Capital | 12 | 16 | 29 | 26 |
| O&M | 51 | 57 | 71 | 70 |
| Salary | 8 | 11 | 15 | 13 |
Source: FCMB, CAM, fiscal year 2018 to 2019 to fiscal year 2021 to 2022
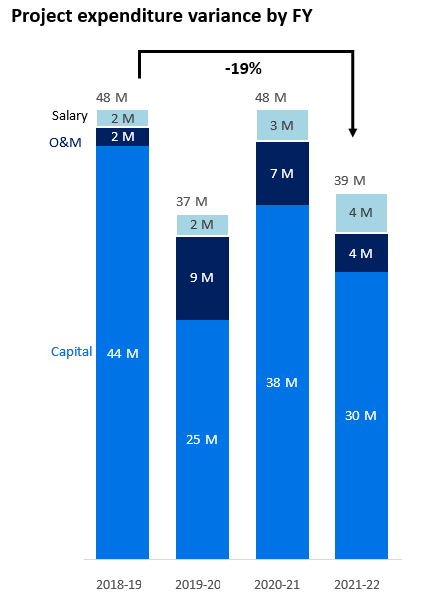
Figure 11 - Text version
| 2018 to 2019 | 2019 to 2020 | 2020 to 2021 | 2021 to 2022 | |
|---|---|---|---|---|
| Capital | 44 | 25 | 38 | 30 |
| O&M | 2 | 9 | 7 | 4 |
| Salary | 2 | 2 | 3 | 4 |
Source: FCMB, CAM, fiscal year 2018 to 2019 to fiscal year 2021 to 2022
Trends in B&E Program expenditure
- A-base expenditure increased by 53% over four fiscal years, generally retaining the same percentage distribution across A-base expenditure categories
- Over four fiscal years, project expenditure fluctuated, with a 19% decrease in fiscal year 2021 to 2022 relative to fiscal year 2018 to 2019
- CAM data has been used for this analysis, as the data reported by the Program in the MAF did not allow for a historical trend analysis of a-base and project expenditures, and CAM is considered the agency's most accurate financial data repository
Page details
- Date modified: